At work·6 min read
Sales Territory Map in PowerPoint That Survives a Reorg
A sales territory map in PowerPoint is a set of shapes with a fill per owner. Everything that can go wrong goes wrong before the first fill, in three decisions — which areas are the units, how many territories, and where the membership list lives.
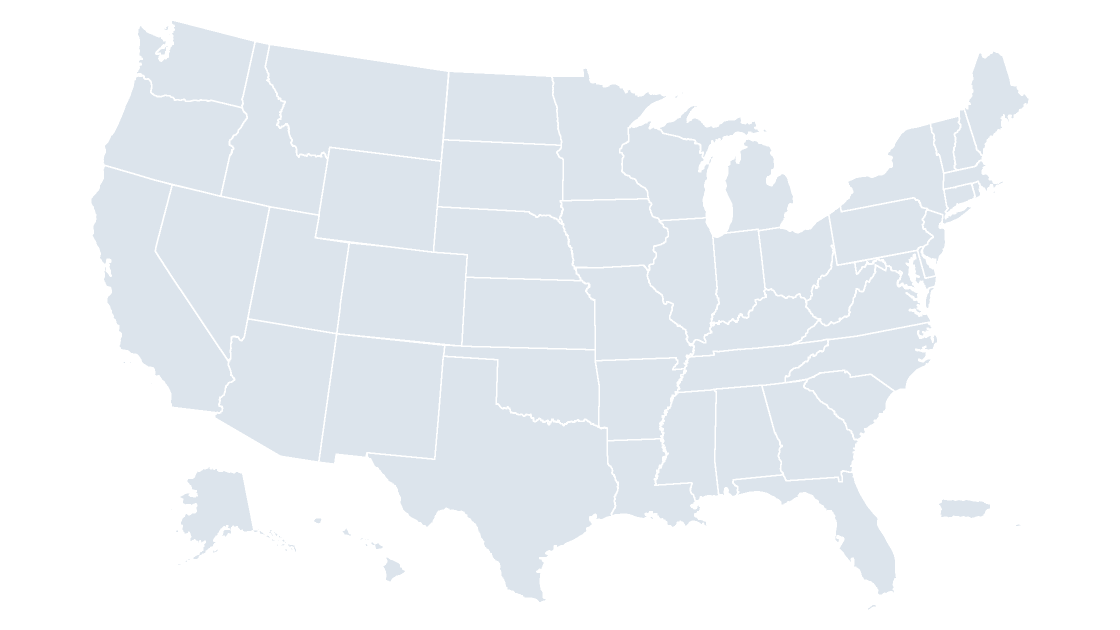
A sales territory map in PowerPoint is not a chart, a data layer or an add-in. It is a set of shapes — one per area — with a fill standing for an owner. The mechanism is that simple, and that is where decks fail: because the fill is the only place the territory exists, a reorg means recoloring by hand, and the slide is the only record of who owns what.
The fix is a writing order: level first, with the shape counts in front of you; territory count second, and low; membership third, in a table keyed on GEOID rather than in the slide. After that the map is five minutes of clicking, and next quarter's revision is five more.
Three decisions, and PowerPoint only cares about the last one
| Decision | The answer that keeps working | What it costs when you skip it |
|---|---|---|
| Which areas are the units | State shapes, unless a territory boundary actually cuts a state | County fills nobody reads as a territory |
| How many territories | Five, six at the outside | Nine fills that read as decoration |
| Where membership lives | A table of GEOID to territory, outside the deck | Every reorg is a redraw; the old map keeps the wrong answer |
Only the third is bookkeeping, and it decides whether the file survives the year.
Choose the level with the counts in front of you
The templates carry five granularities, each a ceiling on how precisely a territory can be drawn:
| Level | Shapes on the slide | A territory map at this level is good for | Where it stops working |
|---|---|---|---|
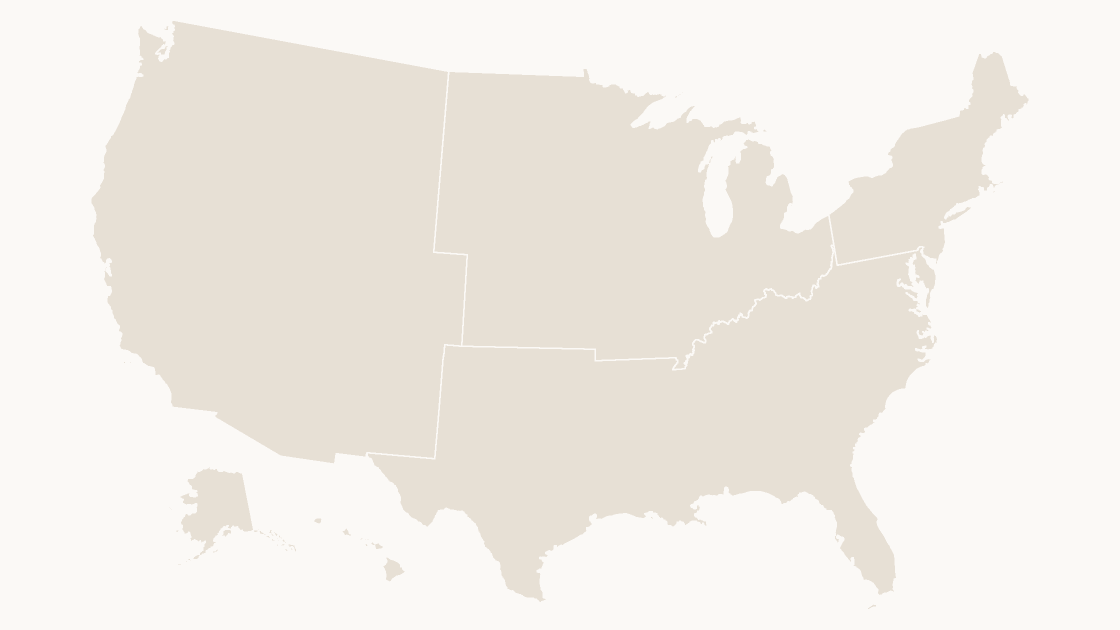
| Census region | 4 | Board-level views, four named regions | Too coarse for any team larger than four |
| Census division | 9 | Regional managers with fixed state groups | New England and the Mountain West split awkwardly |
| State | 53 | Most field teams, most quota plans | A metro territory crossing a state line |
| Congressional district | 441 | Teams that already report by district | Numbers, not names — hard to say out loud |
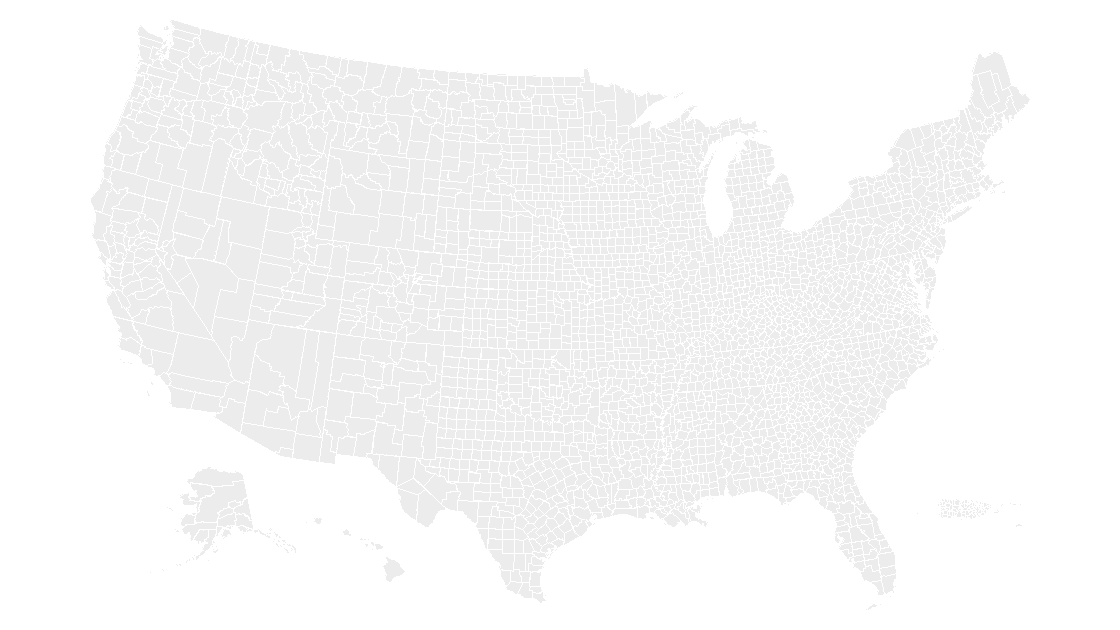
| County | 3,225 | Territories drawn around metros and drive times | Borders vanish into 3,225 county lines |
The state map is 53 shapes — 50 states plus D.C., Puerto Rico and the U.S. Virgin Islands — while the data file holds 56 state-level units, the other three being Guam, American Samoa and the Northern Mariana Islands. And the district level is 441 shapes for 435 voting seats, covered in the district count.
For state-level plans, start from the state map. If the plan is already four regions, the regions map is four shapes and no ungrouping. Go to counties — the county map — only when a boundary genuinely cuts a state.
A territory is a workload, and the map is a rectangle of land
The 3,235 counties in the county file cover 9.16 million square kilometers of land. Split six ways by area, that is 1,527,083 km² per territory — and Alaska alone is 1,479,893 km², or 97 percent of one share. Land area is not a workload.
One state per rep is worse. Alaska at 1,479,893 km² against the District of Columbia at 158 km² is roughly 9,300 to one, yet a state-colored map gives both identical visual weight — which is why territory decks get argued with instead of approved.
County count is a better proxy, and still crude. Texas holds 254 counties, Georgia 159, Virginia 133; Delaware holds 3, the District of Columbia 1. A plan built from whole states runs from one county to 254 before anyone thinks about accounts. Put the number you manage — accounts, headcount, revenue — on the slide and let the map show only the boundary; a shape cannot carry a quota and a territory at once.
Seven territories, measured on the real county file
The county file carries STUSPS on every feature, so a plan can be counted before it is drawn. The script is the whole audit: states, counties and land per territory, with the total as the check.
import json

plan = {
    "Northeast":     "CT ME MA NH RI VT NJ NY PA",
    "Southeast":     "DE DC FL GA MD NC SC VA WV",
    "Midwest":       "IL IN MI OH WI IA KS MN MO NE ND SD",
    "South Central": "AL AR KY LA MS OK TN TX",
    "Mountain":      "AZ CO ID MT NV NM UT WY",
    "Pacific":       "AK CA HI OR WA",
    "Island Areas":  "PR VI GU AS MP",
}

counties = json.load(open("county.geojson", encoding="utf-8"))["features"]
rows = []
for name, states in plan.items():
    owned = states.split()
    mine = [f for f in counties if f["properties"]["STUSPS"] in owned]
    land = sum(f["properties"]["ALAND"] for f in mine) / 1e6
    rows.append((name, len(owned), len(mine), round(land)))

rows.sort(key=lambda r: -r[3])
print(f"{'territory':14s}{'states':>7}{'counties':>9}{'land km2':>11}")
for name, nstates, ncounties, land in rows:
    print(f"{name:14s}{nstates:7d}{ncounties:9d}{land:11,d}")
print(f"{'total':14s}{sum(r[1] for r in rows):7d}{sum(r[2] for r in rows):9d}{sum(r[3] for r in rows):11,d}")
territory states counties land km2
Pacific 5 168 2,320,957
Mountain 8 281 2,217,925
Midwest 12 1055 1,944,011
South Central 8 834 1,562,671
Southeast 9 588 687,143
Northeast 9 218 419,357
Island Areas 5 91 10,431
total 56 3235 9,162,495Read the county column, not the land column. Midwest at 1,055 counties and Northeast at 218 are both nominally balanced by population and wildly unbalanced by the number of places a rep must name.
Fill six, and let the boundary carry the rest
Six fills is the ceiling on a projected slide; most plans should stop at five. Beyond that the reader is matching a legend swatch to a shape forty inches away, which nobody does correctly.
Two rules make six work. Separate adjacent territories in lightness as well as hue — the five-step ramp in the color guide applies even to nominal categories, because two fills of similar lightness read as one territory. Then give every territory a white outline at 1.5 pt, so a shared border never depends on two fills happening to differ.
At county level the county lines are still in the file. Fill 400 counties one color and the result is a wash of 400 outlines, not a territory — which is the case for merging the fill, below.
Union the counties into one territory silhouette
If a territory is a set of counties, the county borders inside it are noise. Merge them away:
Shape Format→Arrange→Ungrouponce, on the county slide, so the shapes are individually selectable.Home→Select→Selection Pane, then click the first county and Ctrl+click the rest. Faster than the canvas on small counties, and it does not shift the map when you miss.Shape Format→Merge Shapes→Union, then set the fill explicitly — do not trust the fill the union landed on.- Click the result once to check it. Mainland and islands lighting up together means one shape; if only part highlights, the pieces stayed separate and you should group them instead.
Union is destructive: the counties become one freeform with no GEOID and no name, so a data join is off the table for that shape from then on. Duplicate the slide first — Ctrl+D, original kept at the end of the deck — and remember Ctrl+Z only saves you inside the same session.
When a territory crosses a state line, fragment instead of redraw
A state shape is atomic: Ohio is one shape, and no fill gives the northern half to one rep and the southern half to another. The way through is to cut it.
Duplicate the state slide, ungroup it, and draw one freeform line down the boundary — Insert → Shapes → Freeform, clicking border points, finishing outside the state at both ends. Select the state and the line together, then Shape Format → Merge Shapes → Fragment. The state becomes two pieces you can union into their territories. The pieces carry no GEOID, so a deck built this way is a picture of a plan, not a dataset — say so on the slide, or someone will try to join a spreadsheet to it.
Keep membership in a table, and the reorg costs one run
The reason to hold membership outside the deck is the second quarter. A reorg arrives as exceptions — three counties move from Central to West, one state changes hands — and if the list lives only as fills, applying it means finding those three counties among 3,225 shapes.
So keep a two-column CSV, geoid,territory. Every GEOID in the county file is five digits, state code plus county code, and it survives renames in a way names do not — the same reason a join on names fails. Point the count script at the CSV instead of the inline plan dictionary: you get per-territory totals to paste into the notes before touching a fill.
The quarterly routine is then mechanical: duplicate the map slide, rename the old one with its quarter, apply new fills to the copy, and type each territory name into its shape so the label belongs to the shape — the same rule as labels on any map slide. Export a PDF for the field, keep the .pptx as the source.
Can the built-in PowerPoint map chart show my territories?
How many territories can one slide show?
Do I need county-level shapes for a territory map?
What happens to my data join after I merge counties?
Start from an inventory of shapes, not a picture
Fifty-three state shapes or 3,225 county shapes, each one editable, named and ready to fill by territory. $9.99, one-time download.
See the state mapThe test for a territory map is not how it looks in the meeting. It is what happens when one state changes hands: if that costs a fill and a label, the file is a tool. If it costs an afternoon with the Selection Pane, it was a picture of last year's org chart.
Questions
Can the built-in PowerPoint map chart show my territories?
How many territories can one slide show?
Do I need county-level shapes for a territory map?
What happens to my data join after I merge counties?
Written in-house. Boundary counts are checked against the published files, and every figure on this page can be reproduced from the source named in it.