PowerPoint and Keynote·5 min read
How to Color a Map in PowerPoint (Without Breaking It)
Two of the three maps you can put on a slide will not take a color where you point. This is which one will, where the command lives, and how to stop the work from coming undone the moment the slide leaves your deck.
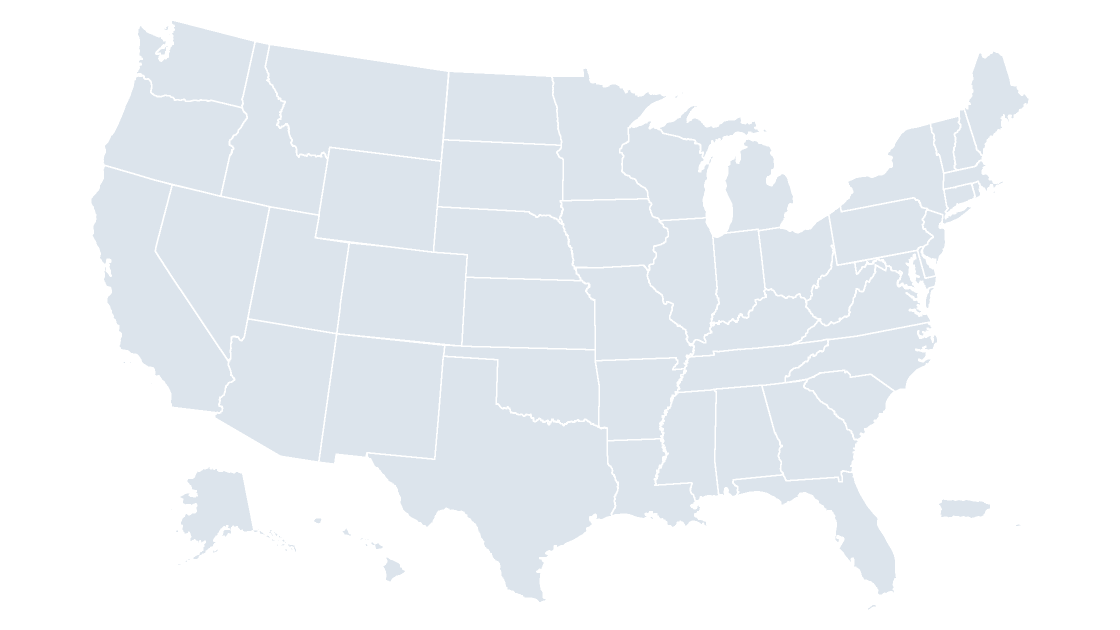
Why a map on a slide is not one shape
Paste a screenshot of a map into PowerPoint and click it. You get one rectangle with a picture in it. Fill that rectangle red and you have filled the rectangle. There is no Ohio in the file — only pixels that happen to sit where Ohio sits.
That single fact explains almost every complaint about coloring maps on slides. I can't select just California. The fill turned the whole map green. Both are true of a picture and false of a vector map, and the difference is not a setting you can switch on after pasting.
So the first question is not which color to use. It is which kind of file you are holding.
Three maps, three different answers
| What is on the slide | Can you fill one area? | What the color controls actually do |
|---|---|---|
| A PNG, JPG or screenshot | No | Recolor or wash the whole picture: Picture Format → Color |
| PowerPoint's built-in map chart | No | One value scale for every region, or one color per series |
| A vector map from a .pptx template | Yes | Every area individually: solid, gradient, pattern, transparency, outline |
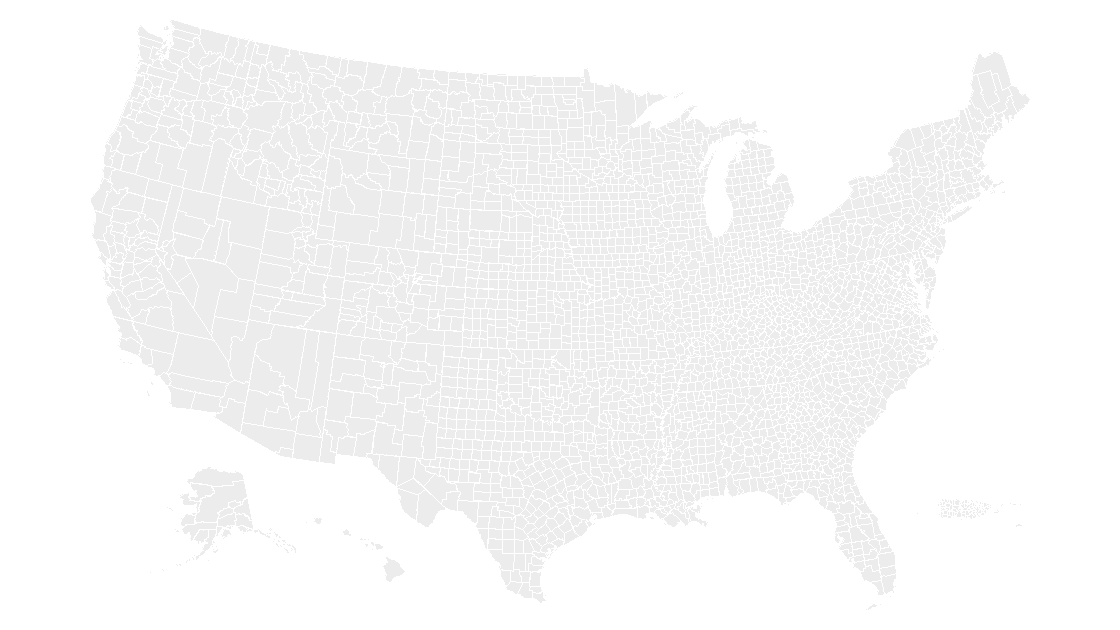
A picture is a photograph of a map. The map chart is a chart: it looks regions up by name at render time and shades them from a table, which is why it can shade a country into five bands from a spreadsheet column and still cannot make one county green because you felt like it. Its region levels stop at country, state or province, and postal code — counties are not in the list.
A vector map is neither. It is a slide full of ordinary PowerPoint shapes that have been drawn in the outline of places. Every shape is a shape, so every shape takes a fill, and the fill behaves exactly the way a fill on a circle behaves. That is the only one of the three where "color the map" means what people assume it means.
Reaching a single state
A well-built map template arrives grouped, because a hundred ungrouped shapes on a slide is impossible to move without losing one. Right-click the map and choose Group → Ungroup. If the file was assembled in layers, ungroup twice — a map inside a frame inside a group is common, and only the innermost group holds the states.
Then open the Selection Pane. On Windows it is Home → Select → Selection Pane; on a Mac the same command sits under Arrange on the Home tab. The pane lists every object on the slide by name, and clicking a name selects that shape.
This matters more than it sounds. At country scale on a 16:9 slide, Rhode Island is about four pixels wide and Delaware is not much bigger. Nobody reliably clicks those. In the pane they are two lines of text.
If the pane reads Freeform 1274 instead of Rhode Island, the file has no names and you are back to hunting pixels. That is worth knowing before you buy a template rather than after — it is the difference between a ten-second edit and an afternoon.
Coloring twenty counties without twenty clicks
Three habits do most of the work:
- Build the group once. Select the areas you need, press
Ctrl+G, and the territory becomes a single object you can fill, copy and restyle from then on. - Set the default shape. Format one shape the way you want, right-click it, choose
Set as Default Shape. New shapes you draw inherit that fill. Existing ones are not touched, which surprises people in both directions. - Copy the format, not the shape.
Ctrl+Shift+Ccopies formatting andCtrl+Shift+Vpastes it onto the next shape, which is faster than reopening the palette forty times.
One warning about Ctrl+A: pressed with a shape selected, it selects every object on the slide, and the next fill you choose applies to all of them. If the whole map just changed color, that is usually why, and Ctrl+Z is the fix.
A five-step ramp that survives a projector
Sequential data needs one hue in five steps, not five colors. Adjacent steps have to differ enough that a projector in a bright room still separates them, and the lightest step has to stay visible against a white slide.
| Step | Hex | Use |
|---|---|---|
| 1 | #E8EFF5 | Lowest class, still visible on white |
| 2 | #C6D8E6 | |
| 3 | #9CBCD3 | Middle class, the one people compare against |
| 4 | #6B93B0 | |
| 5 | #3F6A8C | Highest class; dark enough for white labels |
These are plain hex values rather than theme colors on purpose — the reason is in the next section.
/* Five classes, one hue, even steps in lightness.
   Drop these into the deck's palette so the whole
   presentation stays on the same ramp. */
:root{
  --map-1:#E8EFF5;
  --map-2:#C6D8E6;
  --map-3:#9CBCD3;
  --map-4:#6B93B0;
  --map-5:#3F6A8C;
}
Two adjustments worth making. If the deck will be printed in black and white, the ramp collapses into five greys that are nearly identical — check the print preview, and if it fails, switch to a pattern fill for the top class rather than a darker blue. If the data has a meaningful midpoint (change versus last year, above and below target), a diverging pair reads faster than a ramp: warm on one side, cool on the other, neutral in the middle.
Roughly one man in twelve has some form of color vision deficiency, and red-green is the common one. A single-hue ramp is safe. A red-versus-green map is not, no matter how clear it looks on your monitor — if the two colors carry meaning, pair them with labels or a pattern as well.
When the fill will not take
Five causes, in the order they turn up:
- The map is a picture. Nothing will fix this except a different file.
- You are inside a group. A fill applied to a group applies to every shape in it. Ungroup, or step into the group by double-clicking.
- Something is covering it. A white-filled rectangle behind the map, or a "frame" shape above it, intercepts the click.
Selection Paneshows the stacking order top to bottom; the map is usually at the bottom. - The shape has no fill. With
No Fillset, clicks pass straight through the shape to whatever is behind it. You can still select it from the pane. - The map lives on the slide master. If clicking does nothing at all, the map may be part of the layout rather than the slide.
View→Slide Masteris where it can be edited, and the edit applies to every slide using that layout.
When the map leaves your deck
The most common way to lose an afternoon's coloring is to paste the finished slide into a colleague's deck and watch it change.
The cause is theme colors. In the fill palette, the top row is the deck's theme palette and the row beneath it is standard colors. A shape filled from the top row stores "accent 1", not a hex value, so it re-maps to whatever accent 1 means in the destination deck. A shape filled from the standard row stores the color itself and does not move.
Two ways to keep the result:
- Paste with
Keep Source Formatting, which preserves the fills but also the fonts and the rest of the look. - Or fill with standard colors and hex values, as the ramp above does, so the map is immune to the theme it lands in.
The same rule explains two smaller mysteries. Keynote and Google Slides both import .pptx fills faithfully, and both remap theme colors on import, so a theme-colored map shifts slightly and a hex-colored one arrives intact. And exporting to PDF preserves vector fills exactly — which is the reason to color shapes rather than screenshots in the first place: the ramp stays sharp at any zoom, on any printer, at any size.
Can the built-in map chart shade individual counties?
Why did every state change color when I picked one?
Can I make one state semi-transparent?
Do the colors survive a round trip through Google Slides or Keynote?
The map in these screenshots
Fifty states and D.C. as separate, named shapes carrying their Census GEOIDs — eight slides, three themes, one file.
See the US states mapQuestions
Can the built-in map chart shade individual counties?
Why did every state change color when I picked one?
Can I make one state semi-transparent?
Do the colors survive a round trip through Google Slides or Keynote?
Written in-house. Boundary counts are checked against the published files, and every figure on this page can be reproduced from the source named in it.