PowerPoint and Keynote·6 min read
How to Label a Map in PowerPoint: Type Inside the Shape
Labeling a map is a placement problem, not a font problem. Type the name into the shape so it belongs to the area, center it, and then measure whether the name is narrower than the shape — because on a national map most of them are not.
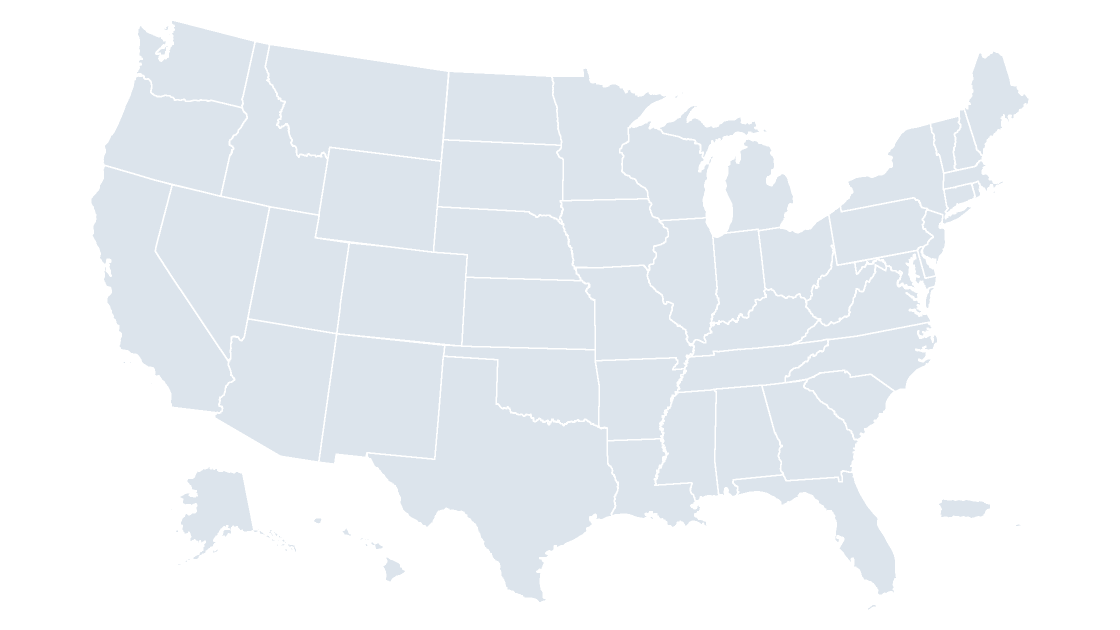
Labeling a map in PowerPoint comes down to one question: does the name belong to the area, or does it float above it? Select the shape, press F2, type — the label becomes part of the object and moves, resizes and deletes with it. Draw a text box on top instead, and the two are strangers from the first drag.
The second half of the answer decides whether the slide looks finished. On the state map the median shape is 0.668 inches wide, and ten of the 53 cannot hold their own name even at 6 points. Type into the shape when the name fits; when it does not, move the label out and connect it with a line.
Three ways a name gets onto an area
| Approach | Where the text lives | What breaks when the deck is edited | Use it when |
|---|---|---|---|
| Type into the shape | The shape's own text body | Nothing — the name is the area | The name fits inside the shape |
| Floating text box | A separate object above the map | The map moves, the label stays behind | Never, on a map you will edit again |
| Connector and callout | A text box plus a line anchored to the shape | The line follows the shape; the box only does if you group them | The area is too small to hold text |
| Number in the shape, names in a key | The shape's text body, one character | Numbers behave exactly like shape text | Many tiny areas, a dozen of them matter |
Why a floating text box is the first thing to break
A text box has no relationship to the shape underneath it. It has no idea it is meant to sit over Ohio, so every operation that moves the map moves the label out of position: drag the map left to make room for a legend and the labels stay where they were. Resize the map and the states shrink while the labels keep their size, because a text box outside the group is untouched by group scaling. It also defaults to a white fill in some themes, painting a white brick over the color you just chose.
Open Home → Select → Selection Pane: a clean map lists one entry per area, and a map with eight floating labels lists eight extra, none of them inside the group that moves.
Typing into the shape, and the one setting that matters
If the map arrived grouped, ungroup it once: Shape Format → Arrange → Ungroup. Grouping is the right state to store a map in and the wrong state to label it in. Then, per area:
- Click the shape once, so handles appear.
- Press
F2, or right-click →Edit Text. A second slow click works too, but a fast double-click on a grouped map attacks the group. - Type the name.
Home→Paragraph→Center.- Right-click →
Format Shape→Text Options→Text Box→Vertical alignment: Middle.
Steps 4 and 5 are not cosmetic. These shapes ship with zero internal insets and default top-left alignment, so a name typed into Rhode Island begins at the top-left corner of Rhode Island's bounding box and runs outward.
A 6-point label with a white outline reads better than the same label at 8 points without one: Shape Format → Text Fill → Text Outline → white, 1 pt. A halo costs no space, and space is what you are short of.
The bounding box is not the area
Once the paragraph is centered, the text centers in the bounding box — the smallest rectangle containing the shape — and the bounding box is not the state. On a compact state the difference is a couple of hundredths of an inch. On a panhandle, an island chain or two peninsulas, it is visible.
Across the 53 shapes on the state slide, the median distance between an area's centroid and the center of its bounding box is 0.027 inches. Sixteen exceed 0.05 inches, and seven exceed a tenth:
| State | Text anchor sits this far from the area's centroid |
|---|---|
| Florida | 0.199 in |
| Alaska | 0.153 in |
| Idaho | 0.148 in |
| Hawaii | 0.143 in |
| Oklahoma | 0.135 in |
| Michigan | 0.122 in |
Florida is the clearest case: its bounding box runs from the Perdido River to the Keys, so the center lands in the Gulf west of the peninsula. Hawaii's centroid falls in open water between islands, the one place a label must never sit.
Neither needs a drawn box. The text frame inside the shape has margins: Format Shape → Text Options → Text Box → Left margin and Top margin, in inches. Type 0.2 into the left margin and a centered name shifts right by about a tenth of an inch while the shape stays put — the only placement control that keeps a label attached to its area.
Measure the name against the shape
The label has a width and the shape has a width, and both are in inches on the same slide. A .pptx is a zip, so the shape widths can be read without opening PowerPoint:
import re, zipfile

EMU_PER_INCH = 914400

with zipfile.ZipFile("us-states--slate.pptx") as z:
    xml = z.read("ppt/slides/slide1.xml").decode("utf-8")

shapes = []
for sp in re.findall(r"<p:sp>.*?</p:sp>", xml, re.S):
    if "custGeom" not in sp:              # skips the four cover text boxes
        continue
    name = re.search(r'name="([^"]*)"', sp).group(1)
    cx, cy = re.search(r'<a:ext cx="(\d+)" cy="(\d+)"', sp).groups()
    shapes.append((name, int(cx) / EMU_PER_INCH, int(cy) / EMU_PER_INCH))

for name, w, h in sorted(shapes, key=lambda s: s[1])[:6]:
    print(f"{name:26s} {w:6.3f} in wide  {h:5.3f} in tall")
print(len(shapes), "state shapes")
It prints District of Columbia 0.024 in wide, then Rhode Island at 0.087, the Virgin Islands at 0.107, Delaware at 0.117, New Jersey at 0.149 and New Hampshire at 0.184, followed by 53 state shapes.
For the text side you need the string's advance width in the font you are using. Measured from Arial's hmtx table, "Rhode Island" is 0.491 inches at 6 points and 0.655 at 8. If you would rather not read font tables, the field estimate is half an em per character — 12 characters at 6 points gives 0.5 inches, within 2 percent.
| Shape | Width on the slide | Its name at 6 pt | Type size that would fit |
|---|---|---|---|
| District of Columbia | 0.024 in | 0.722 in | 0.2 pt |
| Rhode Island | 0.087 in | 0.491 in | 1.1 pt |
| U.S. Virgin Islands | 0.107 in | 1.024 in | 0.6 pt |
| Delaware | 0.117 in | 0.352 in | 2.0 pt |
| New Jersey | 0.149 in | 0.435 in | 2.1 pt |
| New Hampshire | 0.184 in | 0.593 in | 1.9 pt |
| Vermont | 0.190 in | 0.315 in | 3.6 pt |
| Connecticut | 0.194 in | 0.440 in | 2.6 pt |
Ten of the 53 shapes are narrower than their own name at 6 points. At 8 points it is sixteen, at 10 points twenty-one — and that is the reason a map which looks fine while you type looks broken from the back of a room.
The ten names that do not fit
Four honest ways out:
- Abbreviate.
RI,CT,DE,DCfit at 9 points where the full name never will. Fine when the legend says so once. - Move the label out and connect it.
Insert→Shapes→Elbow Connector, drag from the label to the shape, and drop on one of the green dots that appear on hover. The connector is now attached and stretches with the shape when the map is resized; a plain line will not. - Number the shape, name it in a key.
1inside the shape, ten names beside the map. The only approach that still works when areas are smaller than the type. - Pull the region out into an inset. An enlarged Northeast panel, drawn once at the size the labels need. Costs slide space, buys legibility for nine states.
Group each label with its connector — Shape Format → Arrange → Group — or the next nudge of the map separates them. Do not group the labels with the shapes: one group takes one fill command, and you will recolor the text along with the map.
At county scale, label a subset and say so
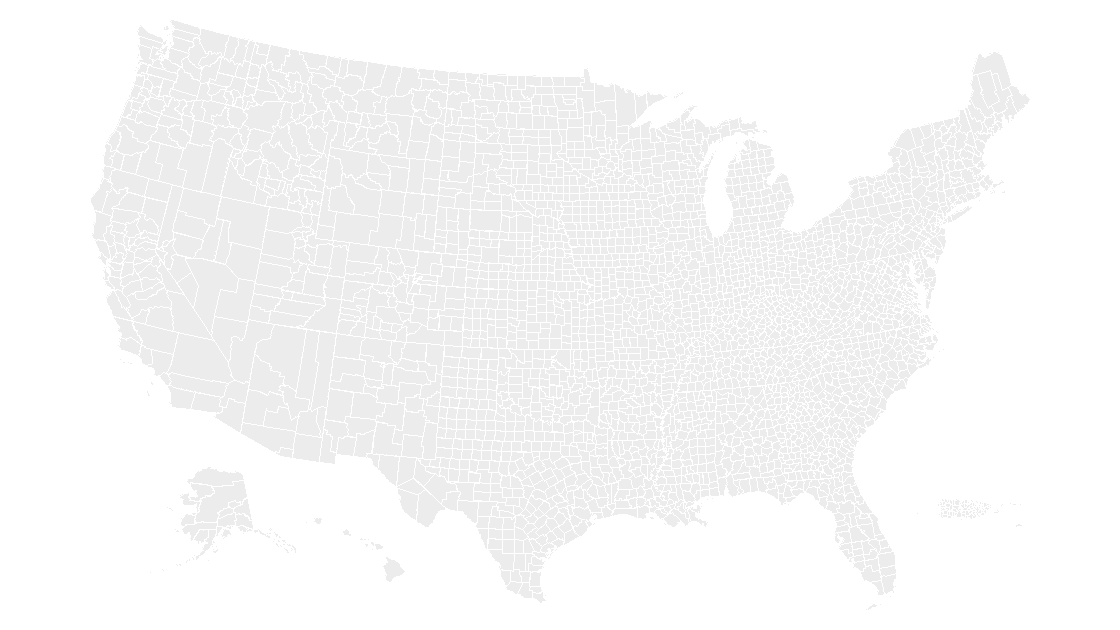
The county slide holds 3,225 freeform shapes. The median county is 0.062 inches wide; the widest, Aleutians West Census Area, is 0.472. Not one of the 3,225 can hold its full name at 6 points, and only 20 can hold the bare name without the word "County", because 3,213 of them are under 0.3 inches.
That settles the design question. A county map is not labeled exhaustively; it is labeled where a number is being argued about. Type in the dozen counties that carry the story and let the fill do the rest — the county map is built to be shaded rather than annotated, and picking the ramp earns more than labeling 3,225 areas would.
Can I add labels the way a chart adds data labels?
How do I change the font on every label at once?
What size should a label be for a projector?
Why did my label shrink when I resized the map?
Start from shapes a label can live in
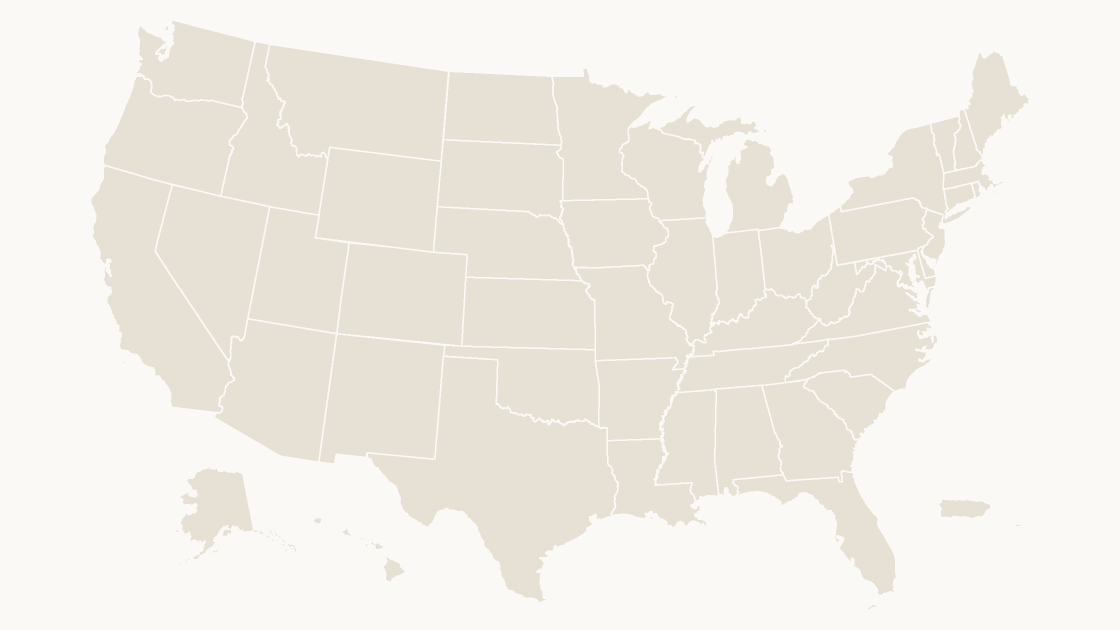
Fifty states plus D.C., Puerto Rico and the Virgin Islands, each one a separate shape with its own text body, so a name typed into Texas stays in Texas. $9.99, one-time download.
See the state mapThe final test takes ten seconds: select the whole map and drag it. If every name travels with its state, the labels were placed correctly. If one is still sitting where the map used to be, that one is a text box — and it will do the same thing in front of an audience.
Questions
Can I add labels the way a chart adds data labels?
How do I change the font on every label at once?
What size should a label be for a projector?
Why did my label shrink when I resized the map?
Written in-house. Boundary counts are checked against the published files, and every figure on this page can be reproduced from the source named in it.