Map data·6 min read
US Census Regions and Divisions: 4, 9, and the 51 Units Inside Them
Four census regions, nine divisions, and 51 units inside them — the 50 states plus the District of Columbia. The two layers are the coarsest geography the Census Bureau publishes, and they are the two that a national dataset most often fails to join.
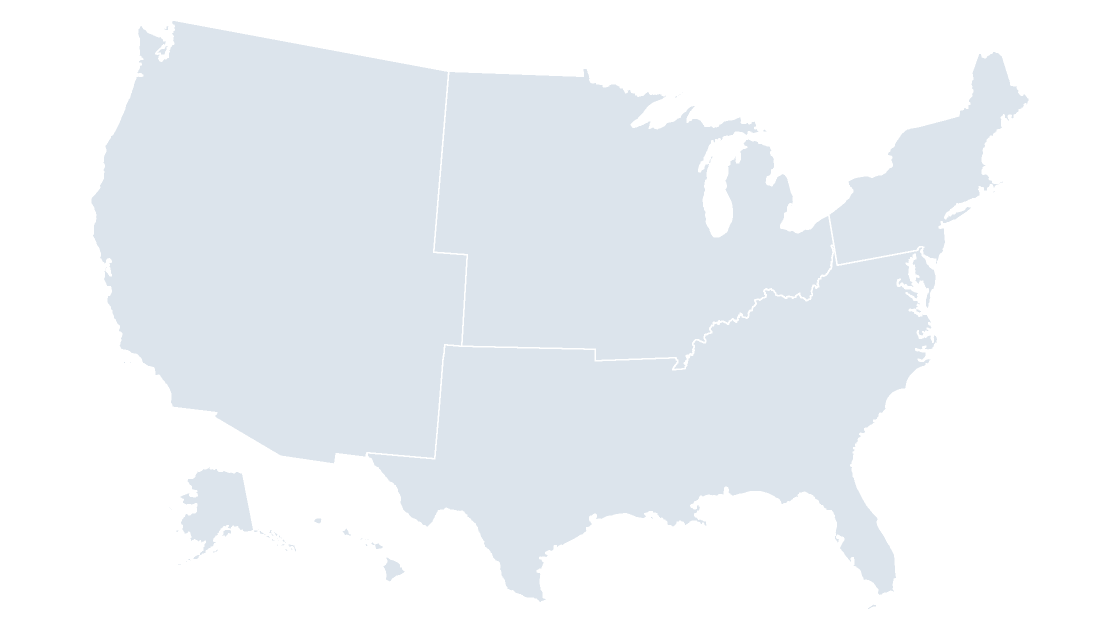
The short answer: four regions, nine divisions, fifty-one units
The United States is grouped into four census regions, and each region is split into divisions — nine in total. Those two layers cover 51 units: the 50 states and the District of Columbia. Puerto Rico and the four other territories are inside neither layer.
That is the whole structure. The rest of this page is about the three places it bites: the codes that tell you which layer you are holding, the missing state-to-division column, and a total that comes out 10,431 km² short if you trust the wrong file.
The nesting is arithmetic, and it is exact
Open data/region.geojson and you get four features. Open data/division.geojson and you get nine. The four are not drawn independently: each region's land area is the exact sum of its divisions, which means a region value and a division value can sit on the same slide without a reconciliation note.
| Region | GEOID | Divisions | Units | Land area | Share |
|---|---|---|---|---|---|
| Northeast | 1 | 2 | 9 | 419,357 km² | 4.58% |
| Midwest | 2 | 2 | 12 | 1,944,011 km² | 21.24% |
| South | 3 | 3 | 17 | 2,249,814 km² | 24.58% |
| West | 4 | 2 | 13 | 4,538,882 km² | 49.59% |
| Total | 9 | 51 | 9,152,064 km² | 100% |
The West holds half the country's land in 13 units, so the average one is enormous. The Northeast holds nine units in 4.58% of the land, about 46,600 km² each — which is why a four-region map reads as three big blocks and one small corner, and why an audience that expects equal-area quadrants finds it wrong at first glance.
Nine divisions, and what each one holds
The division layer is the one most federal tables actually use, so it is worth knowing the shape of it before you match a spreadsheet to a fill color.
| Division | GEOID | Region | Units | Land area |
|---|---|---|---|---|
| New England | 1 | Northeast | 6 | 162,377 km² |
| Middle Atlantic | 2 | Northeast | 3 | 256,981 km² |
| East North Central | 3 | Midwest | 5 | 629,312 km² |
| West North Central | 4 | Midwest | 7 | 1,314,699 km² |
| South Atlantic | 5 | South | 9 | 687,143 km² |
| East South Central | 6 | South | 4 | 461,760 km² |
| West South Central | 7 | South | 4 | 1,100,911 km² |
| Mountain | 8 | West | 8 | 2,217,925 km² |
| Pacific | 9 | West | 5 | 2,320,957 km² |
The numbering is not alphabetical, and it is not random either: codes 1–2 are the Northeast, 3–4 the Midwest, 5–7 the South, 8–9 the West. Sorting by GEOID gives you the regions in order; sorting by name gives you East North Central first and West South Central last.
Here is the membership, which is the table people search for:
| Division | States and districts |
|---|---|
| New England | CT, MA, ME, NH, RI, VT |
| Middle Atlantic | NJ, NY, PA |
| East North Central | IL, IN, MI, OH, WI |
| West North Central | IA, KS, MN, MO, ND, NE, SD |
| South Atlantic | DC, DE, FL, GA, MD, NC, SC, VA, WV |
| East South Central | AL, KY, MS, TN |
| West South Central | AR, LA, OK, TX |
| Mountain | AZ, CO, ID, MT, NM, NV, UT, WY |
| Pacific | AK, CA, HI, OR, WA |
Two of the nine arrive as a single ring — West North Central and Mountain, at 4,544 and 2,294 points. The Pacific division is the opposite: 171 separate parts, stretching from longitude −179.15 to 179.78 because the Aleutians cross the antimeridian. Fit that to a slide frame and the continental United States shrinks to a stamp, which is why the region deck and the division deck both carry Alaska and Hawaii as insets rather than following the raw extent.
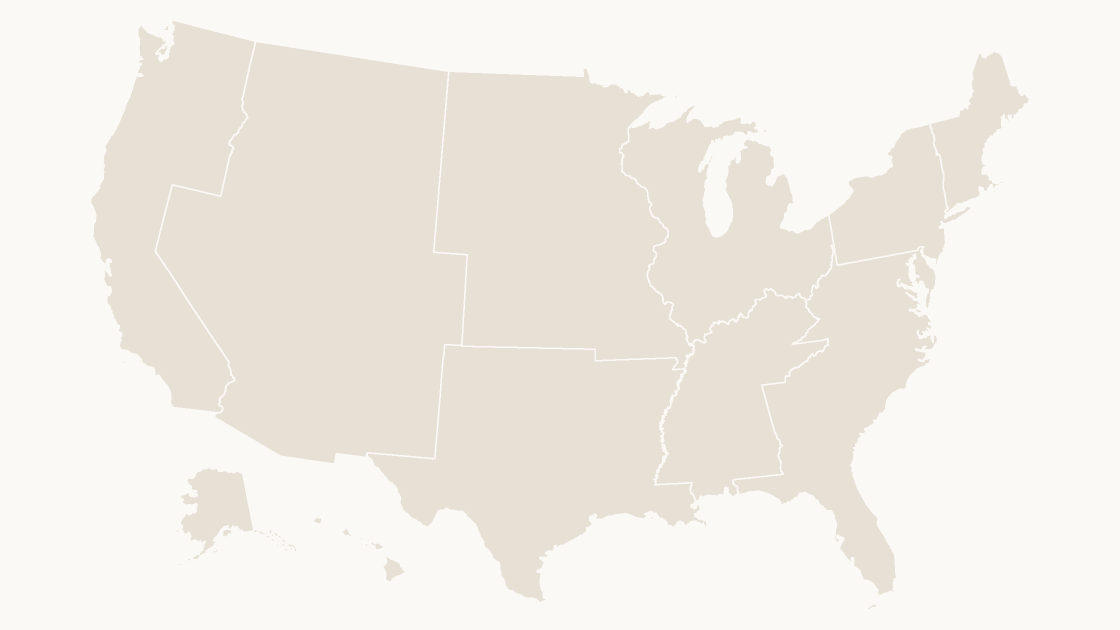
The code prefix tells you the level before the name does
Every feature in these files carries a GEOIDFQ, and the leading digits are the summary level, not part of the entity code:
0200000US3— a region, the South0300000US3— a division, East North Central0400000US21— a state, Kentucky0500000US06037— a county, Los Angeles
Two things follow. First, the 02 and 03 prefix is the only thing separating the South from East North Central, both of which end in 3. Strip the prefix, keep the trailing digit, and you have a column where two different geographies share every value. Second, LSAD carries 68 for a region and 69 for a division, so a filter written for counties, where LSAD is 06 on almost all 3,235 of them, returns nothing at all on these layers.
Names are worse than the codes, for the usual reason: South is a region, a division name contains the word twice, and no field anywhere says which one you are looking at. The FIPS and GEOID walkthrough covers the full pattern; the short version is to join on the whole prefixed string and label with the name.
The state file has no region column, so derive it
This is the practical snag. data/state.geojson carries STATEFP, STATENS, GEOIDFQ, GEOID, STUSPS, NAME, LSAD, ALAND and AWATER. There is no REGION field and no DIVISION field. The region and division files have areas and geometry but no member list either, so there is no crosswalk anywhere in the boundary data — in either direction.
You can bring a lookup table, or you can ask the polygons. The second takes a few seconds and no dependencies:
import json

def rings(g):
    return [g['coordinates']] if g['type'] == 'Polygon' else g['coordinates']

def ring_area(r):
    s = 0
    for i in range(len(r) - 1):
        x1, y1 = r[i][:2]
        x2, y2 = r[i + 1][:2]
        s += x1 * y2 - x2 * y1
    return abs(s) / 2

def inside(pt, poly):
    def in_ring(r):
        x, y = pt
        hit = False
        for i in range(len(r) - 1):
            x1, y1 = r[i][:2]
            x2, y2 = r[i + 1][:2]
            if (y1 > y) != (y2 > y):
                if x < (x2 - x1) * (y - y1) / (y2 - y1) + x1:
                    hit = not hit
        return hit
    return in_ring(poly[0]) and not any(in_ring(h) for h in poly[1:])

def centroid(r):
    a = cx = cy = 0
    for i in range(len(r) - 1):
        x1, y1 = r[i][:2]
        x2, y2 = r[i + 1][:2]
        cr = x1 * y2 - x2 * y1
        a += cr
        cx += (x1 + x2) * cr
        cy += (y1 + y2) * cr
    return (cx / (3 * a), cy / (3 * a))

divs = sorted(json.load(open('data/division.geojson', encoding='utf-8'))['features'],
              key=lambda d: d['properties']['GEOID'])
states = json.load(open('data/state.geojson', encoding='utf-8'))['features']

members = {}
for s in states:
    parts = sorted(rings(s['geometry']), key=lambda p: ring_area(p[0]), reverse=True)
    pt = centroid(parts[0][0])
    hit = [d['properties']['NAME'] for d in divs
           if any(inside(pt, p) for p in rings(d['geometry']))]
    members[s['properties']['STUSPS']] = hit[0] if hit else 'none'

for d in divs:
    name = d['properties']['NAME']
    codes = sorted(k for k, v in members.items() if v == name)
    print('{:20s}{:>3}  {}'.format(name, len(codes), ' '.join(codes)))
print('outside every division:', sorted(k for k, v in members.items() if v == 'none'))
New England 6 CT MA ME NH RI VT
Middle Atlantic 3 NJ NY PA
East North Central 5 IL IN MI OH WI
West North Central 7 IA KS MN MO ND NE SD
South Atlantic 9 DC DE FL GA MD NC SC VA WV
East South Central 4 AL KY MS TN
West South Central 4 AR LA OK TX
Mountain 8 AZ CO ID MT NM NV UT WY
Pacific 5 AK CA HI OR WA
outside every division: ['AS', 'GU', 'MP', 'PR', 'VI']Fifty-one assigned, five left over. That last line is the part worth keeping.
What the layers leave out: five territories
The 51 units are the 50 states plus the District. The five territories have their own polygons in data/state.geojson, so a state-level table usually includes them, but no region or division polygon contains them:
| Territory | Code | Land area |
|---|---|---|
| Puerto Rico | PR | 8,870 km² |
| Guam | GU | 544 km² |
| Northern Mariana Islands | MP | 472 km² |
| U.S. Virgin Islands | VI | 348 km² |
| American Samoa | AS | 198 km² |
| Total | 10,431 km² |
Puerto Rico alone is larger than Delaware (5,047 km²) and more than three times Rhode Island (2,678 km²), so this is not a rounding detail — a national table with a PR row simply has nowhere to land on a division map. Decide it explicitly: drop the row and footnote it, or keep a gray shape outside the frame. What you cannot do is shade the region layer with a value for a place it does not contain.
Neither layer is an administrative unit. There is no region government, no division capital and no budget attached to either polygon — they exist so that federal statistics can be grouped and published. A slide that calls the four regions "jurisdictions" invites a question you cannot answer.
Do not sum an aggregate layer and call it the national total
Add up the four regions and you get 9,152,064 km². Add up the 56 features in the state file and you get 9,162,496 km². The difference is 10,431 km², which is exactly the territory table above, to within a square kilometer.
Both numbers are correct; they answer different questions. The gap is 0.11% of the total, small enough that nobody catches it in review and large enough that it makes a footnote wrong. If the figure has to be a national land area, sum the state layer or the county layer, which lands on the same total as the state layer to the square meter. Sum the region layer only when you want the area of the 51 units it actually covers.
Four shapes or nine on a slide
Pick by what the audience has to read, not by how much detail you can fit. Four regions give you four labels — Northeast, Midwest, South, West — that fit inside their own shapes at any slide size, so the map reads without a legend. Nine divisions give you the level most federal series are published at, which means the map and the data come from the same table and no roll-up is needed. The cost is East North Central in a shape slightly narrower than Illinois and Wisconsin combined; at projector scale it wraps to two lines, and in the small divisions of the Northeast it does not fit at all. Label the four big ones and key the rest.
Filling either layer is the easy part, because there is one shape per unit rather than 3,235: select in the Selection Pane, then Shape Format → Shape Fill. The coloring mechanics are the same as any other map, and the coloring walkthrough covers selection at scale. What matters here is narrower: a four-region map has so few shapes that a five-step color ramp is wasted on it, and a nine-division map has enough that two adjacent divisions in the same family will look like one region if you skip the boundary line.
How many census regions and divisions does the United States have?
Which census division is my state in?
Is Puerto Rico in a census region?
Can I add region totals to a state-level table?
Four regions, nine divisions, already drawn
Both layers as editable shapes — 4 regions or 9 divisions, every one a named shape you can fill and label. $9.99, one-time download.
See the regions mapQuestions
How many census regions and divisions does the United States have?
Which census division is my state in?
Is Puerto Rico in a census region?
Can I add region totals to a state-level table?
Written in-house. Boundary counts are checked against the published files, and every figure on this page can be reproduced from the source named in it.