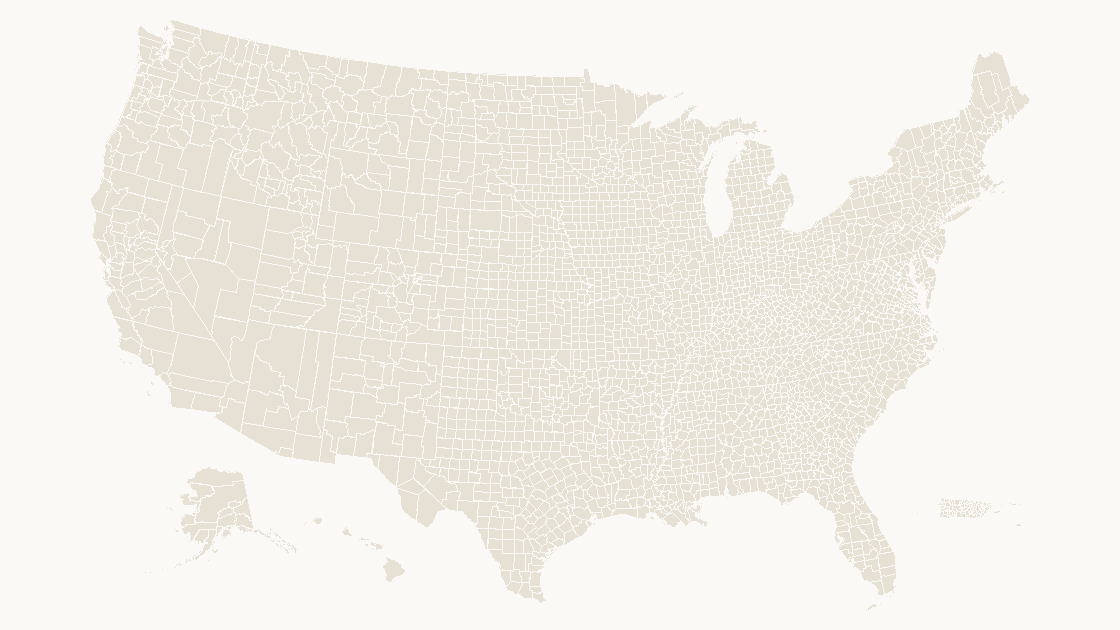
Preview shows the map slide in Editorial, Mono, Slate. Every deck also contains cover, labelled, data, spotlight, table and source slides.
United States Counties
All 3,235 counties and county equivalents — the finest level at which US economic and demographic data is published.
One-time purchase · 3 .pptx files, every theme included · 14-day refunds, no questions asked · Terms and Privacy
Every county and county equivalent. Counties are the finest level at which US economic and demographic data is published consistently, which makes this the map for anything that needs to be precise.
Typical use: Territory design, site selection, demographic detail.
| Price | $19.99 — one-time, no subscription |
|---|---|
| Format | PowerPoint .pptx — opens natively in Keynote |
| File size | 2.27 MB |
| Boundary source | U.S. Census Bureau, 2025 Cartographic Boundary Files |
| Projection | Albers equal-area conic, with insets for Alaska, Hawaii and Puerto Rico |
| Coordinates | WGS84 longitude / latitude |
| Licence | Commercial use permitted; resale of the files is not |
| Refunds | Full refund within 14 days if not downloaded, or if the file is defective — see the refund policy |
Related templates
 $19.99
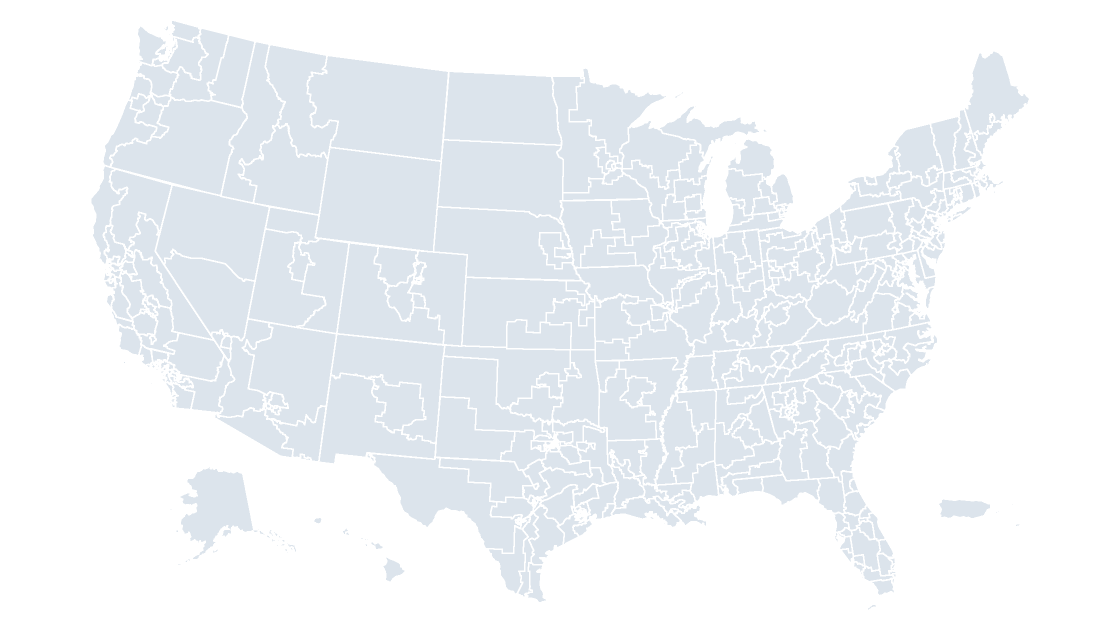
United States Congressional Districts
All 441 districts of the 119th Congress, ready for election night, advocacy and public-affairs decks.
 $19.99
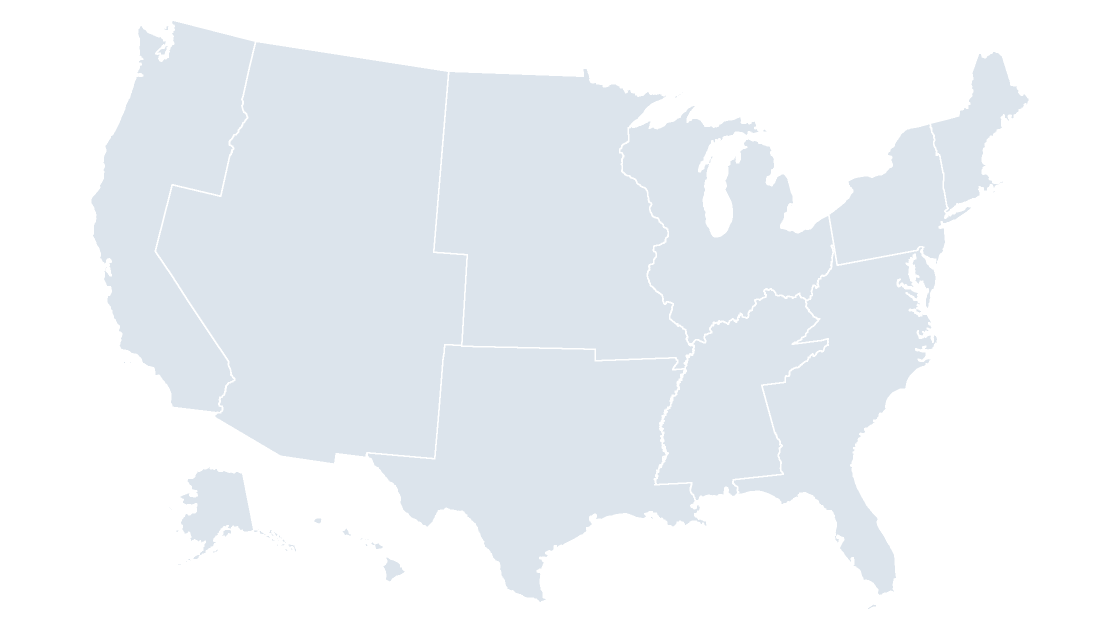
United States Census Divisions
The nine divisions beneath the four regions — the level most federal statistics are actually published at.
 $19.99
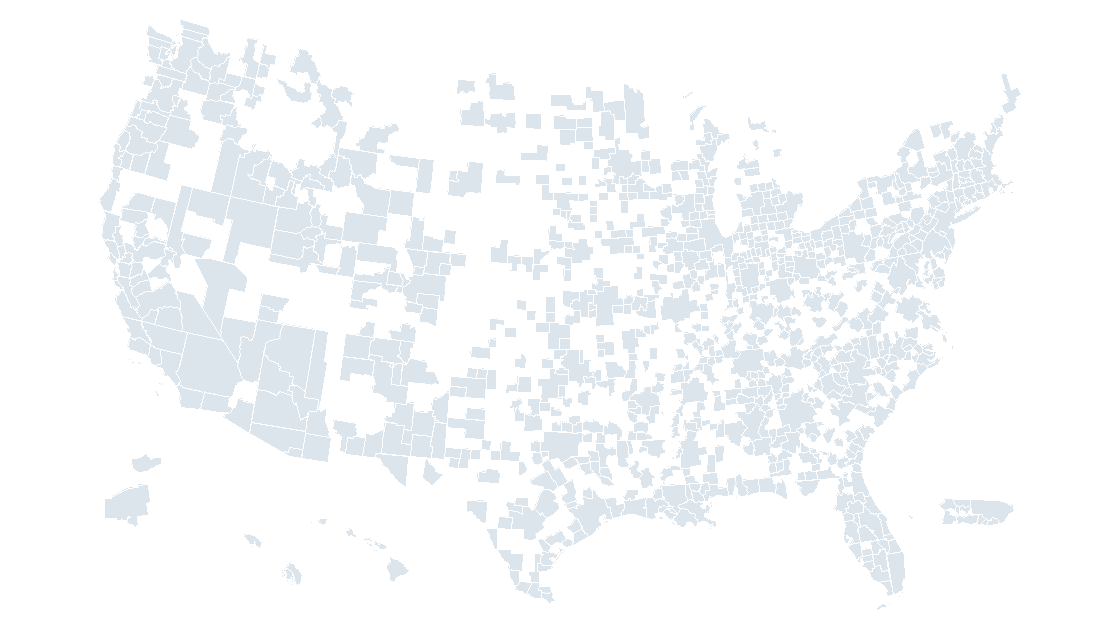
United States Metro Areas
All 935 Metropolitan and Micropolitan Statistical Areas, the geography behind most US labour-market and sales data.