PowerPoint and Keynote·6 min read
How to Make a Map in Keynote: Import Shapes, Then Edit Them
You do not draw a map in Keynote, because Keynote has no geography in it at all. You open a .pptx whose areas are real shapes, ungroup them, and fill them one at a time from the Format sidebar. Every step below is a menu path, not a guess.
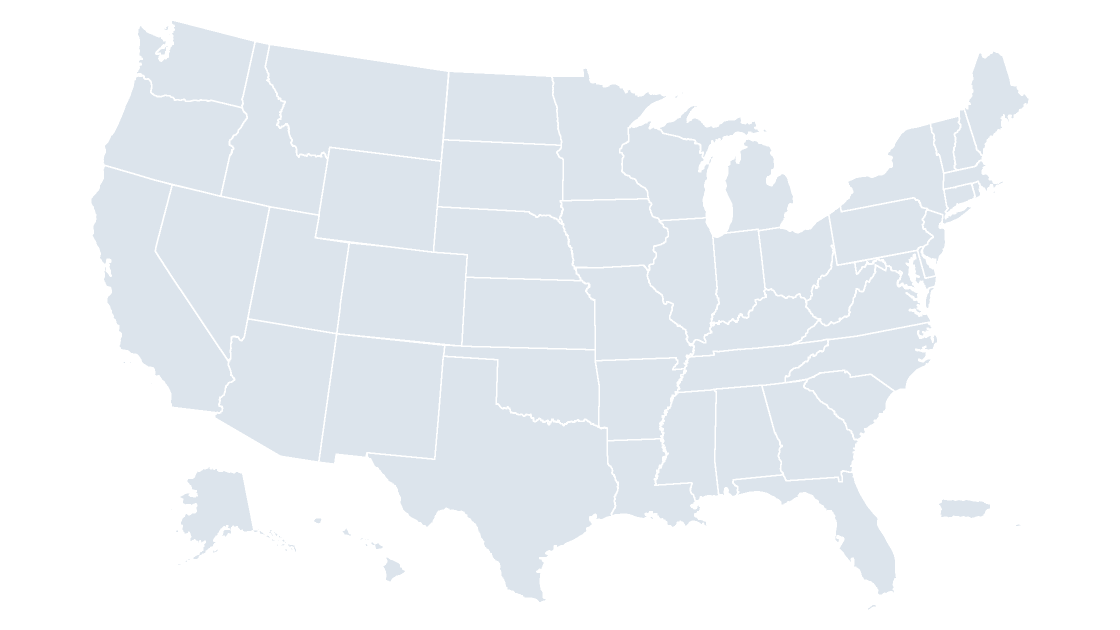
There is no map chart in Keynote, so the map has to arrive as shapes
Open Keynote's chart inspector and you get a fixed list: column, bar, line, area, pie, donut, scatter, bubble, and the interactive versions of the same. There is no map chart, no region lookup, and no way to type a state name and have a shape appear. Numbers has the same gap. So anyone who has built a shaded map in Excel and then opened Keynote has already noticed the wall.
The way past it is to stop treating the map as a chart. If each county or state is an ordinary shape — a freeform path with a fill, the same object type as a rounded rectangle — then Keynote can fill it, outline it, fade it, and move it, because those are shape operations, not chart operations. That is what an editable map template is, and importing one is the whole technique.
Two routes into a slide, and only one of them stays editable
| Route | What you do | What lands on the canvas | What you can still change |
|---|---|---|---|
| Insert a picture | Insert → Choose…, pick a PNG or a screenshot | One image object | Brightness, contrast, the whole-image color wash |
| Open the deck | File → Open… on the .pptx, or drag the file onto the Keynote window | A presentation whose slides hold groups of native shapes | Each area's fill, outline, opacity, and position |
Both routes produce a map that looks correct in the slide navigator. Only the second one survives a request to "make Texas red and leave the rest pale." With a picture, the only honest answer is to go back to the source file and re-export, which is why screenshots of maps show up in decks that are already out of date.
A PDF map exported from a GIS tool is not a third route. Keynote opens PDFs as page images, and Format → Arrange will offer no ungroup — the paths are there in the file and the objects are not.
Opening the PowerPoint file without flattening it
Use File → Open… rather than double-clicking the .pptx in Finder, so Keynote imports it as a new Keynote document instead of handing it to PowerPoint. If Keynote shows a warning that some elements were changed during import, accept it and check the map before you do anything else: the shapes are what matter, and they survive.
Then look at the geometry, not the slide. Click the map once. If the entire outline lights up as a single selection with a single bounding box, the file arrived grouped — which is correct, and the next section deals with it. If individual pieces light up, the file arrived loose and you have less work to do but a bigger risk of dragging one county out of place by accident.
Two things to confirm before you color anything:
- It is one slide, not eight. Map templates ship several slides — a whole-country view, a regional view, a blank one — and only the first usually holds the full geometry.
- The fills are hex values, not theme colors. Keynote re-maps theme colors on import. A map built on accent colors will land one shade off; a map filled with hex values lands exactly as it was.
What is inside the file, counted rather than described
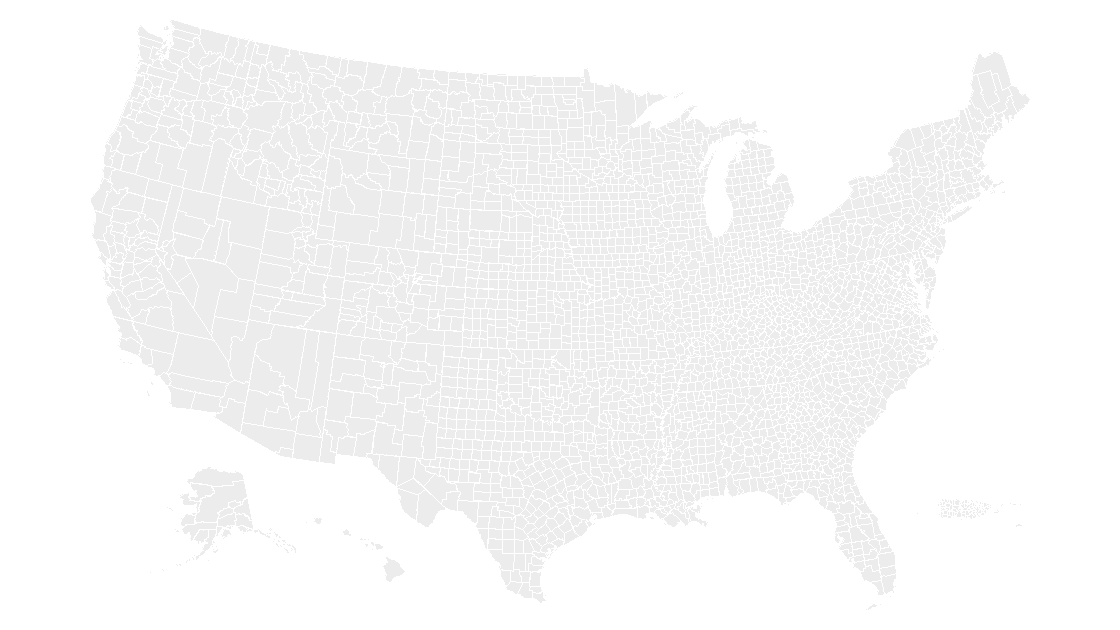
The county deck on this site is eight slides. Slide 1 holds a single group, and inside that group are 3,225 freeform shapes plus six text boxes. No images: the whole map is vector paths, which is why it stays sharp when you zoom to 400 percent to check a corner of Rhode Island.
You can verify that against any .pptx you are about to import, without opening PowerPoint — a .pptx is a zip, and the shapes are countable:
import re, zipfile, pathlib

ppt = pathlib.Path("us-counties--slate.pptx")
with zipfile.ZipFile(ppt) as z:
    slides = sorted(n for n in z.namelist()
                    if re.fullmatch(r"ppt/slides/slide\d+\.xml", n))
    xml = z.read(slides[0]).decode("utf-8")
shapes = re.findall(r"<p:sp>.*?</p:sp>", xml, re.S)
freeform = [s for s in shapes if "custGeom" in s]
print(f"{len(slides)} slides")
print(f"{len(freeform):,} freeform shapes on slide 1")
print(f"{ppt.stat().st_size:,} bytes")
Run it on that file and it prints 8 slides, 3,225 freeform shapes on slide 1, 2,609,485 bytes. The state deck is the same idea at a smaller weight: us-states--slate.pptx is 434,520 bytes, because 50-odd outlines cost far less than 3,225 of them. If a file you are considering is a few hundred kilobytes and prints zero freeform shapes, it is a picture with a .pptx extension and no amount of ungrouping will help.
Ungrouping, and why you should do it late
To break the group: select the map, then Format → Arrange → Ungroup. The inspector's Arrange tab has the same command as a button. Repeat it if the map was assembled in layers — a country inside a frame inside a group is common, and only the innermost group holds the states.
Do it as late as you can, and regroup as soon as you can. A slide with 3,225 loose shapes is a slide where Edit → Select All selects everything, where a stray drag moves one county into the Atlantic, and where the object count makes every subsequent click slower. The safe rhythm is: ungroup, style one area, Command-click the rest you need, then Format → Arrange → Group and treat the result as one object again.
Two habits that save the afternoon:
Arrange→Lockon anything you have already colored correctly. Locked objects ignore clicks, so the map underneath stops being a minefield.- Tab to walk the objects. Pressing
Tabwith nothing selected selects the next object on the slide, which is the closest thing Keynote has to a selection pane. Name your groups (Format→Arrange→ the name field) and you can at least tell what you are standing on.
Filling one area from the Format sidebar
Select the shape, open the Format sidebar, and stay on the Style tab. Under Fill choose Color, then open the color well, switch the picker to RGB Sliders, and type the hex value. The opacity slider underneath is per shape, not per map, so a single county can go to 40 percent to show a gradient or a photo behind it.
For a data-driven deck, the value of this is that a state or county behaves like a cell: change its fill and only that area changes. Twenty counties in a sales territory become twenty fills, or — faster — one Group that takes a single fill and can be copied to the next slide intact.
Label placement is the part Keynote will not do for you. The deck's text boxes are decorative; the labels that matter are text boxes you place yourself, slid over the shape and set to Style → Text → white with a 1-point shadow if the fill is dark. At county scale, label everything and the slide becomes noise: label the five areas the sentence on the slide is about, and leave the other 3,220 alone. That is the same judgment call as in coloring a map in PowerPoint, where the answer is also fewer labels, better placed.
Exporting back out, and the iPad edge case
File → Export To gives you PowerPoint, PDF, Images, or a movie. Export to PowerPoint when the file has to go back to a Windows colleague: the shapes survive the round trip and arrive as freeforms again, though any theme colors will re-map. Export to PDF when the deck is going to a printer or a projector you do not control — vector fills stay vector, and 3,225 paths print at any size without a jagged edge.
On iPad and iPhone, Keynote opens .pptx files and the shapes are editable, but the workflow degrades in one specific way: there is no multi-select across a group by lasso, and the Arrange tab is behind a popover. Coloring one state is fine; coloring forty is a desktop job. Build the map on the Mac, then hand the finished file to the iPad for presenting.
Can Keynote add a map chart the way Excel does?
Will a PowerPoint map template open in Keynote without losing anything?
How do I select one county when the map is grouped?
Do I need PowerPoint installed to edit the map?
The state map used above
Every state as a named shape carrying its Census code, in eight slides and three themes — one file, $9.99, opens in Keynote as well as PowerPoint.
See the US states mapQuestions
Can Keynote add a map chart the way Excel does?
Will a PowerPoint map template open in Keynote without losing anything?
How do I select one county when the map is grouped?
Do I need PowerPoint installed to edit the map?
Written in-house. Boundary counts are checked against the published files, and every figure on this page can be reproduced from the source named in it.