Choosing a file·6 min read
Editable Map vs Map Chart: Which One to Build the Deck On
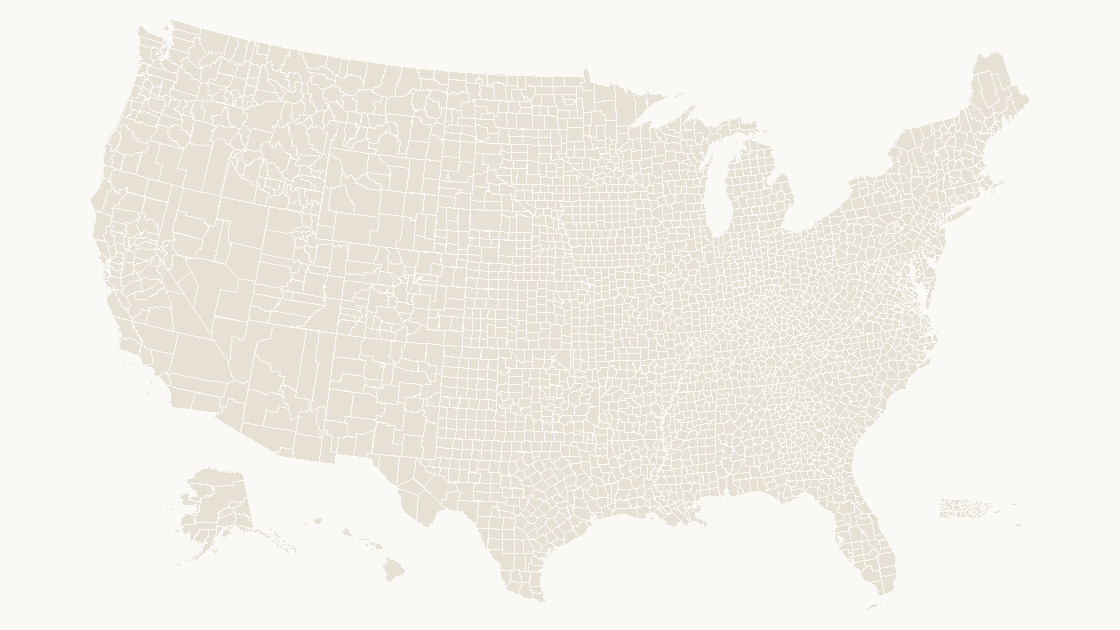
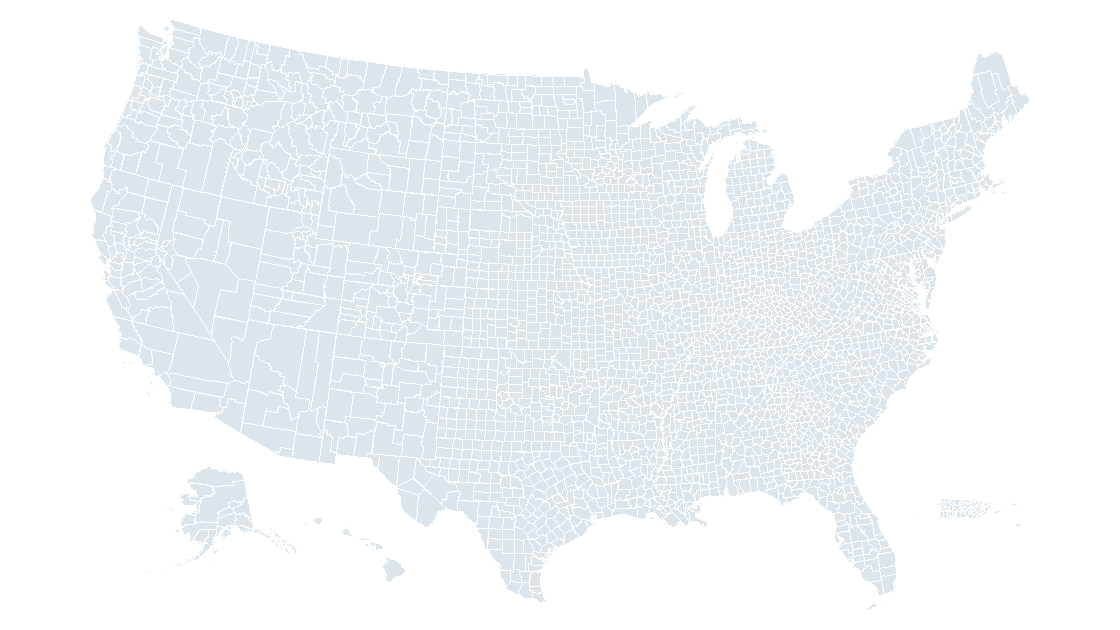
Choose the map chart when the numbers will be revised every month and the geography stops at a state line. Choose an editable map when the slide has to show counties, open on a machine without Microsoft 365, or let one region be pulled out and moved beside a bullet. They are not two versions of the same thing — one is a chart that looks region names up, the other is 3,235 shapes.
The answer depends on what happens after you present
At 100 percent zoom, with matching fills, a map chart and an editable map are nearly indistinguishable on a slide. That is why the argument about them goes nowhere: the choice is not visual, and it is not about quality. It is about what is inside the file, which decides what you can still change at eleven the night before a board meeting.
So decide with two questions. Will the values be revised, repeatedly, by someone else? Then the map chart wins and it is not close — it re-shades itself from a spreadsheet column. Does the deck need county detail, a region that leaves the map, a file that opens in Keynote, or a machine with no subscription on it? Then it has to be shapes.
One object against 3,235
Click a map chart and the status bar reports a single object. Underneath it is a chart: a worksheet with a place in one column and a value in the next, plus a renderer that turns each place name into a polygon every time the chart is drawn. The polygons are not in your file. Only the names and the numbers are.
Click a county map built from shapes and open the Selection Pane — Home → Select → Selection Pane on Windows, Arrange on the Home tab on a Mac — and it lists 3,235 entries, one per county, each an ordinary freeform shape with a fill you can address by name.
| Map chart | Editable map | |
|---|---|---|
| Objects on the slide | 1 chart | 3,235 shapes |
| Where the geometry lives | A Microsoft service, resolved at render time | Inside the .pptx |
| How a region is identified | The name string in the first column | The shape name, plus whatever code you keep in it |
| Change one region's fill | Only through its value, or as its own series | Click the shape and set a fill |
| Pull a region out of the map | No | Yes — ungroup, then move it |
| Merge counties into a territory | No | Yes — Shape Format → Merge Shapes → Union |
| Opens in Keynote or Google Slides | As a picture, or as nothing | As editable shapes |
| Editing with no connection | No | Always |
| Follows new numbers automatically | Yes, and that is the point | No — you re-fill |
Nine rows, and only two of them usually decide it.
Where the chart earns its place
Picture a monthly market update: one value per state, twelve slides, numbers landing in a spreadsheet the week before. Insert → Chart → Map, paste two columns, and the shading sorts itself into five automatic classes. Next month you replace column B and the map redraws. Nobody touched a shape, nobody chose a color, and the ramp is consistent across every slide because the same table fed all of them.
That is a real advantage and it disappears at exactly one point: when the geography drops below a state line. The chart's region levels are country, state or province, and postal code — county is not among them, so a county table has nothing to match against. What the chart needs, and the four ways it fails is documented on its own page; for this decision the short version is enough: county work is shape work.
Where the shapes earn theirs
Three jobs come up again and again, and none of them can be performed on a chart:
- A territory that is not a boundary. Sales regions, service areas, and school catchments are built from counties. With shapes, select the counties in a territory, then
Shape Format→Merge Shapes→Unionto make it one area with one fill. The counties are still underneath if the definition changes next quarter. - One area, pulled out. A callout map — Florida at twice the scale, pinned beside a paragraph — is a shape you drag. A chart region cannot leave the chart.
- A file that opens anywhere. A shape map is an ordinary slide. Keynote and Google Slides both import it with the fills intact, because there is nothing to resolve. A map chart handed to either arrives as a flat picture, and the geometry was never in the file to recover.
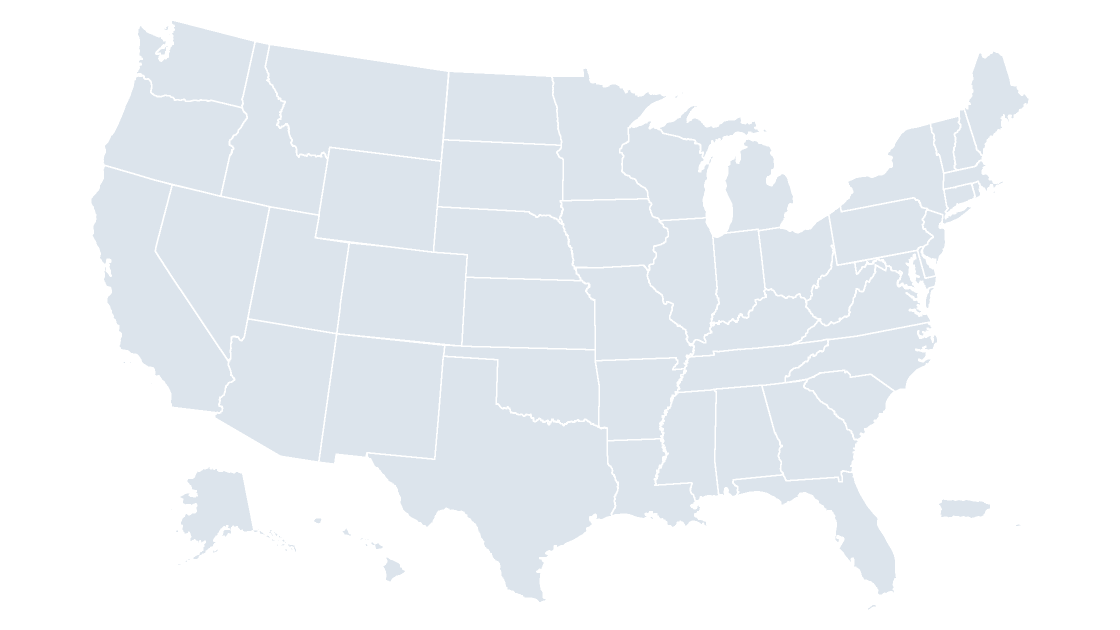
The county map behind those three jobs is 3,235 named shapes across all fifty states; if county detail is more than the slide needs, fifty states and D.C. is the same idea at the other end of the scale.
The bill arrives in month two
Every editable map carries one recurring cost, and it is the flip side of the row that says "you re-fill": the fills are yours. A chart reads column B; shapes do not know column B exists. On a three-slide deck that is ten minutes of clicking. On 3,235 counties it is the reason people give up and go back to screenshots.
The way out is to stop treating shading as a design act and treat it as a table you compute once. Five classes, cut at the quintiles of whatever column you are mapping:
import json
from pathlib import Path

features = json.loads(Path("us_county.geojson").read_text(encoding="utf-8"))["features"]
areas = sorted(f["properties"]["ALAND"] for f in features)

def quintile(p):
    i = (len(areas) - 1) * p
    lo = int(i)
    hi = min(lo + 1, len(areas) - 1)
    return round(areas[lo] + (areas[hi] - areas[lo]) * (i - lo))

breaks = [quintile(p) for p in (0.2, 0.4, 0.6, 0.8)]
print(breaks)
print([sum(1 for a in areas if a < b) for b in breaks])
Run it against the 2025 county layer and the five bands come back equal:
[996080706, 1396171940, 1837643730, 2655351864]
[647, 1294, 1941, 2588]
Four breaks, five classes, 647 counties in each. Hand the breaks to a ramp and the ramp is finished:
| Class | Land area from (m²) | to (m²) | Counties | Fill |
|---|---|---|---|---|
| 1 | 82,093 | 996,080,705 | 647 | #EEF2F5 |
| 2 | 996,080,706 | 1,396,171,939 | 647 | #CBD6DE |
| 3 | 1,396,171,940 | 1,837,643,729 | 647 | #9FB1BF |
| 4 | 1,837,643,730 | 2,655,351,863 | 647 | #6C8496 |
| 5 | 2,655,351,864 | 377,536,045,709 | 647 | #3B5266 |
Equal counts are the reason this works. The distribution is not gentle — the median county holds 1.56 billion square meters of land, Rose Island in American Samoa holds 82,093, and Alaska's Yukon-Koyukuk holds 377.5 billion, four thousand times the median. Equal-width bins would put 3,200 counties in the first band and paint a single dark borough in the second. Quintiles keep the map readable without anyone choosing where to cut.
ALAND excludes water. Shade by it and a coastal county shrinks to its dry ground, which is correct for density and wrong for the map an audience remembers from a weather forecast. AWATER is in the same property set, one line away in the same script.
Names are the hinge
Both objects decide which region is which by a name, and the county layer shows how thin that thread is. Of 3,235 counties, only 1,927 names are unique. 443 names are reused, and 1,751 features carry one of them: Washington 31 times, Franklin 26, Jefferson 26, Jackson 24, Lincoln 24.
A chart resolves a bare Washington through a lookup service, which then has to guess — and if it guesses wrong, there is no error, just a county shaded in the wrong place. Shapes do not guess. The name is on the shape, and GEOID 48453 sits beside it in the same property set, which is how you can always tell Travis County, Texas from the other Travis. Why the code outlives the name is a separate article; the rule for either object is to carry the code, not only the label. If a county table has to feed a chart anyway, write each row as County, State — that pair is what makes the match unique.
A two-minute test on the deck in front of you
Run these four checks on the file you already have, in order, and it will tell you which object you are holding:
- Click the map. If the status bar reports one object and
Arrange→Group→Ungroupis greyed out, it is a chart. - Open the Selection Pane. Three thousand names, or one, is a complete answer.
- Drag one state two inches to the right. A shape moves. A chart region snaps back.
- Disconnect the network and reopen the file, then send it to a colleague who uses Keynote.
If any of the last three surprised you, the deck is built on the object that fails them. Recoloring it afterward is the easy part once the shapes exist.
Is an editable map better than PowerPoint's map chart?
Can I convert a map chart into shapes?
How do I fill 3,235 counties without clicking each one?
Does the chart still open if the subscription lapses?
Take the county layer as shapes
3,235 named counties, one fill per shape, nothing resolved from a name and no connection needed. $9.99 per template, one-time.
See the county mapQuestions
Is an editable map better than PowerPoint's map chart?
Can I convert a map chart into shapes?
How do I fill 3,235 counties without clicking each one?
Does the chart still open if the subscription lapses?
Written in-house. Boundary counts are checked against the published files, and every figure on this page can be reproduced from the source named in it.