Map data·6 min read
Census Tract vs Block Group: One Digit, Two Different Jobs
A census tract is a statistical area built around 4,000 people. A block group is that tract cut into one to nine pieces. They differ by one digit in the identifier, and that digit decides whether your roll-up totals or quietly drops rows.
A census tract is a statistical subdivision of a county designed to hold between 1,200 and 8,000 people, with about 4,000 as the target. A block group is a subdivision of that tract, designed for 600 to 3,000 people, and every tract contains at least one of them. The two carry keys of 11 and 12 digits, and the extra digit identifies which slice of the tract you are looking at.
Which one you want depends on what happens to the number next. Take the block group when you need the finest detail that still carries an official key. Take the tract when the figure has to be compared across years, because tracts are updated rather than rebuilt. And if the end product is a slide, take neither as a drawing — roll either one up to counties, which is a substring operation rather than a spatial join.
One digit separates the two, and it is a block range in disguise
Both units are statistical, not legal: no tract elects anyone or levies a tax, so they can be redrawn to follow population, and the Census Bureau's Participant Statistical Areas Program lets local planners propose the boundaries before each decennial count.
The block group digit is the part most people misread. It is not a name or a rank but the first digit of the four-digit block number: blocks 3000 through 3999 belong to block group 3, and 1000 through 1999 to block group 1. A block group is a header over a range of blocks.
| Census tract | Block group | |
|---|---|---|
| Population the Census aims for | 1,200 to 8,000, target ~4,000 | 600 to 3,000 |
| Digits in the key | 11 | 12 |
| Nests inside | County | Census tract |
| Crosses a county line | Never | Never |
| Crosses a tract line | — | Never |
| Smallest unit it is built from | Block groups | Blocks |
| Drawn by | Local participants, reviewed each decade | Local participants, built on block ranges |
The key ladder, counted in digits
Each level is its parent's key plus more digits, never a code from a separate numbering system:
| Level | Key | Digits | Composition |
|---|---|---|---|
| State | 06 | 2 | State FIPS |
| County | 06037 | 5 | State FIPS + county FIPS |
| Census tract | 06037101100 | 11 | County key + 6-digit tract |
| Block group | 060371011001 | 12 | Tract key + block group digit |
| Block | 060371011001003 | 15 | Block group key + 3-digit block |
The practical consequence: a tract's key begins with its county's key, character for character. You never need a spatial join to find out which county a tract belongs to. Take the first five characters and you have it. The same holds one level down — the first eleven characters of a block group key are a tract key. The digit-by-digit anatomy of both codes covers the level above this one.
The tract segment itself is four digits, a decimal point that is never stored, and two decimal places: 1011.00 is written 101100. Tract 000100 is the first tract in its county and the sequence steps upward by 100. Nothing in the number says where inside the county the tract sits — the same trap district numbering sets. The code is an identifier, not a coordinate.
Nesting is a promise, and it is why the roll-up totals
The Census Bureau states the rule plainly: tract boundaries always follow state and county boundaries, and a block group never crosses a state, county, or tract boundary. Those are not conventions that happen to hold in most places; they are design constraints on how the units are built.
That single guarantee changes the arithmetic. Summing a tract variable to a county is exact — no sliver of a tract sits in the next county, so nothing has to be split, weighted, or apportioned. The same is true of block groups to counties, one level removed, because nesting is transitive. Every number totals to something real.
Compare that with geographies that do not nest. A congressional district sits inside one state but is drawn over counties and can split one, so a district-to-county roll-up needs area or population weights and the result stops being a count of people. A ZCTA follows mail routes rather than county lines, which is why every ZIP-to-county table is an allocation with a footnote.
One documented exception: tribal census tracts and tribal block groups are defined on federal reservations and can cross state and county lines. They are a different entity type — exclude them before you trust a prefix-based roll-up.
What the county file already tells you about scale
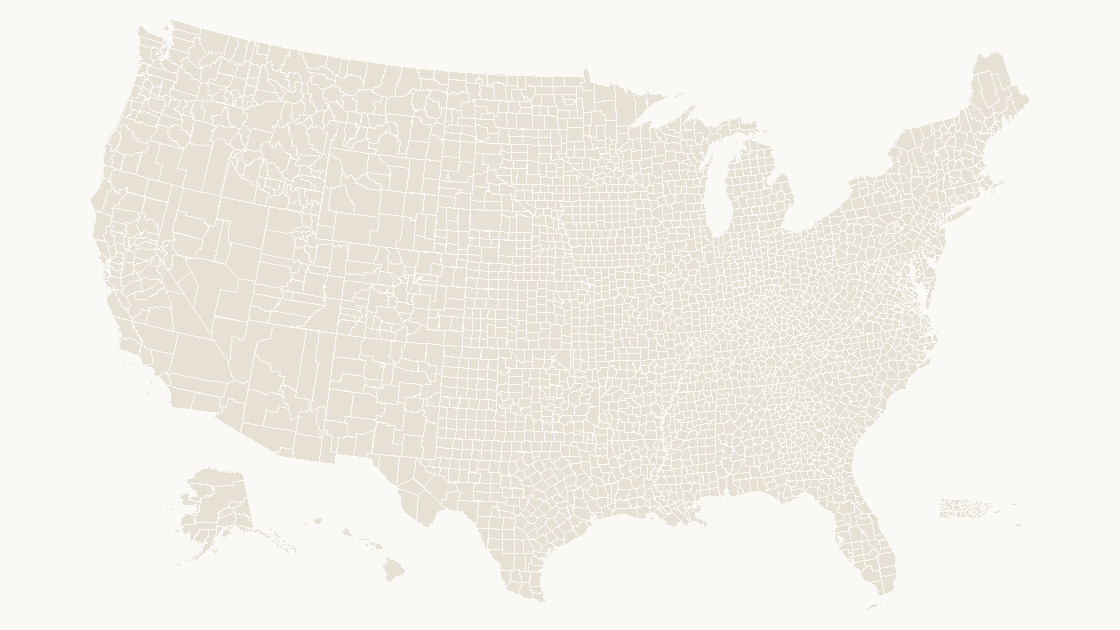
Everything below the county is finer than a projected page can carry. The 2025 Census cartographic boundary file holds 3,235 features — 3,144 in the fifty states and D.C., the other 91 in Puerto Rico and the island territories — and every key is five characters and unique.
| Measure | Value |
|---|---|
| Features in the file | 3,235 |
| Features in the fifty states and D.C. | 3,144 |
| Median land area | 1,561 km² |
| Largest, Yukon-Koyukuk Census Area, Alaska | 377,536 km² |
| Smallest, Rose Island, American Samoa | 0.08 km² |
Counties stored as MultiPolygon | 109 |
| Shapes in the county map we ship | 3,225 |
You can reproduce every row from the file in a few lines:
import json
import statistics

counties = json.load(open("data/county.geojson", encoding="utf-8"))["features"]
keys = [c["properties"]["GEOID"] for c in counties]

print(len(keys), "features,", len(set(keys)), "unique keys")
print("key lengths:", sorted({len(k) for k in keys}))
print("state parts:", len({k[:2] for k in keys}))

land = statistics.median(c["properties"]["ALAND"] for c in counties)
print("median land area:", round(land / 1e6), "km2")

one = keys[0]
print(one, len(one), len(one + "000100"), len(one + "000100" + "1"))
3235 features, 3235 unique keys
key lengths: [5]
state parts: 56
median land area: 1561 km2
13111 5 11 12Three thousand two hundred thirty-five shapes is already the densest geography that reads on one slide. Tracts sit an order of magnitude below that and block groups below the tracts, so a national tract map is not a slide with more detail — it is a gray field where the boundaries have merged into texture.
Roll up before you draw: five characters do the join
If the deliverable is a slide, the data workflow ends at counties, and it is four steps:
- Keep the key as text. A tract key starts with a two-digit state code, and seven states — Alabama, Alaska, Arizona, Arkansas, California, Colorado and Connecticut — carry a code below 10. Open the CSV in a spreadsheet and the leading zero goes, turning a California tract into a ten-digit number that matches nothing in any file. Those seven states hold 318 of the 3,235 counties, enough to make a bad join visible on the map.
- Take
key[:5]as the county key. No lookup table, no point-in-polygon, no projection. This works because of the nesting rule above. - Sum the counts, weight the ratios. Adding tract populations to get a county population is correct. Averaging tract percentages is not: the mean of forty rates gives a tract with 900 people the same weight as one with 7,000. Sum the numerator and denominator first, then divide.
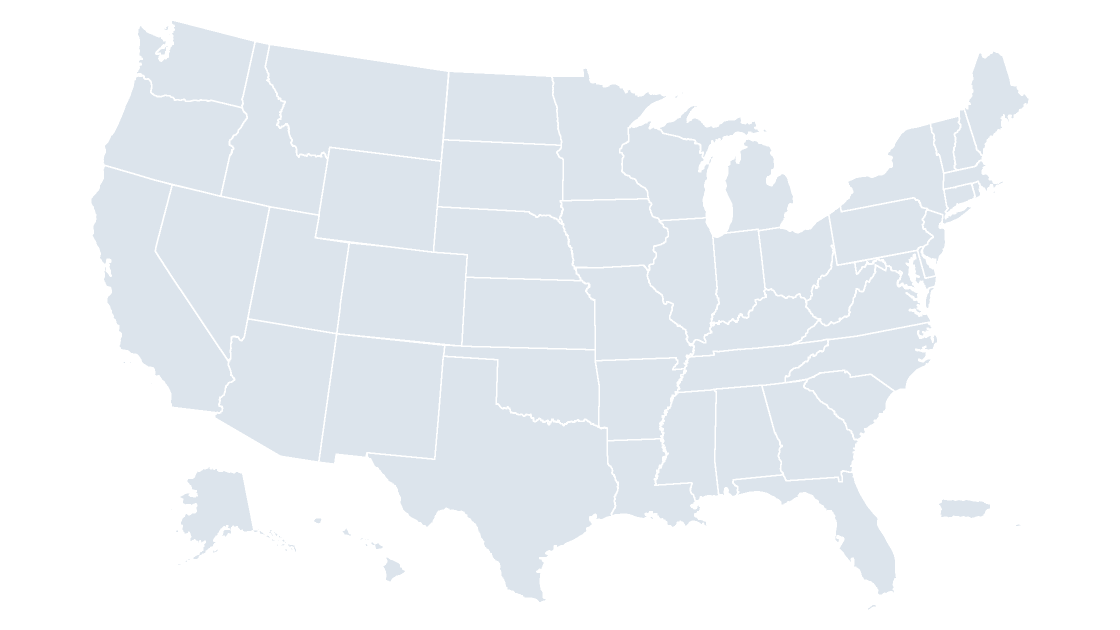
- Match the map to the geography. The national county template carries 3,225 shapes with the five-digit key on the reference slide, so a county table joins without a lookup. For a single state, the California county map holds only its own counties, which makes a mismatch visible on one screen.
Where the block group still earns its place
Going below the tract is not wrong, it is a decision about the reader. Block groups are the right unit when the question is internal to one place: which half of a city sits fifteen minutes from a proposed site, or where the under-five population clusters inside one school's attendance area. That is one metro on one page, and a few hundred shapes are legible.
Pull the view back to the nation and the same data has to become a rate at a coarser level. Drawing every block group in the country communicates the same thing less clearly, and it drags a 15-digit block key along with it.
Two questions to settle before you open PowerPoint
The tract-or-block-group decision collapses once you ask what happens to the number after it is drawn:
| If the answer is | Use | Because |
|---|---|---|
| "It has to be comparable to 2015" | Census tract | Tracts are split and merged rather than redrawn, so most keys survive a decade |
| "It has to be the finest available official unit" | Block group | It is the smallest unit with a stable published key and complete tabulations |
| "It goes on a slide, one page, national" | Neither — roll up to county | 3,235 shapes is the readable limit |
| "It goes on a slide, one metro" | Tract, or block group inside one city | A few hundred shapes read fine at that zoom |
Which of the two you map is a detail. Whether the data still totals at the level you are drawing is decided by the digits, not by the drawing.
Is a block group the same thing as a census block?
Do census tracts follow county boundaries?
How many people live in a census tract?
Can I put block group data on a map slide?
The level that fits on a slide
3,225 county shapes, every one separately fillable, with the five-digit GEOID printed on the reference slide so a tract or block group table rolls up and joins without guessing. $9.99, one-time download.
See the county mapQuestions
Is a block group the same thing as a census block?
Do census tracts follow county boundaries?
How many people live in a census tract?
Can I put block group data on a map slide?
Written in-house. Boundary counts are checked against the published files, and every figure on this page can be reproduced from the source named in it.