Map data·6 min read
UK Counties vs Unitary Authorities: 218 Areas Explained
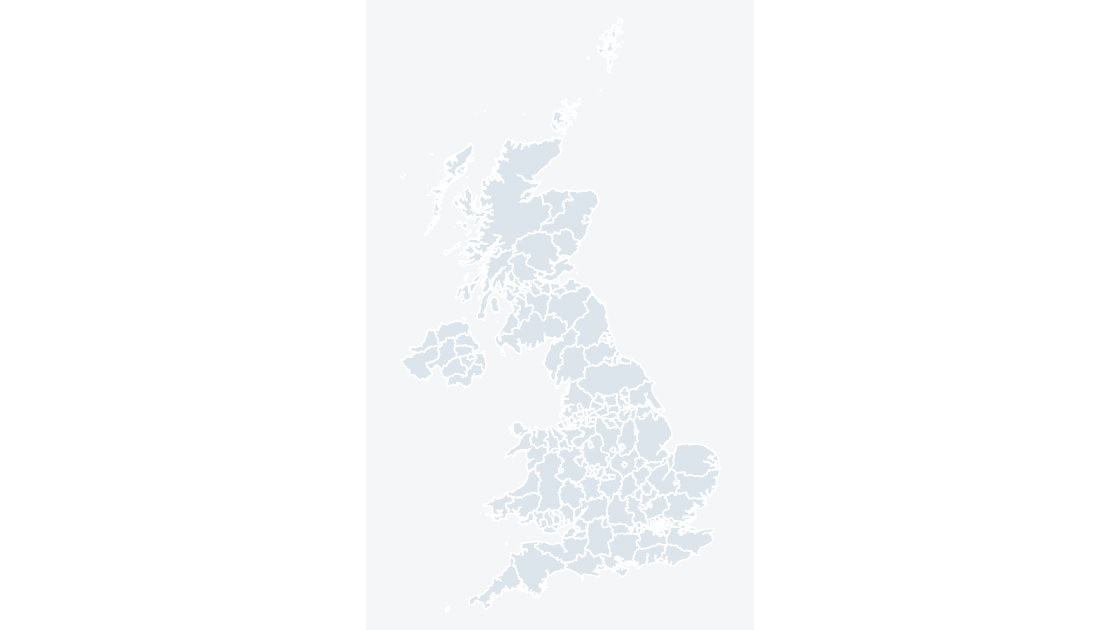
A UK county map has 218 areas and only 21 of them are county councils. The rest are unitary authorities, metropolitan districts, London boroughs, council areas, principal areas and Northern Ireland districts, all of which run their services with nothing beneath them.
The count that looks wrong until you add it up
The confusion starts with a number. You ask for a county map of the UK, you open the file, and the selection pane says 218 shapes. England does not have 218 counties, so either the file is wrong or the word "county" is doing something you did not expect.
It is the second one. In the ONS release this site builds from, "counties and unitary authorities" is a single statistical level, not a single kind of institution. It contains 218 areas: 153 in England, 32 in Scotland, 22 in Wales and 11 in Northern Ireland. Of those 218, exactly 21 are county councils with district councils beneath them. The other 197 are single-tier authorities that run every local service themselves.
So the answer to "county or unitary authority" is usually "both, and the difference is whether anything sits below it."
Two tiers in 21 places, one tier everywhere else
The two-tier model survives only in parts of England. Elsewhere it was abolished decades ago, which is why a map titled "counties" still carries council areas and principal areas to cover the whole country.
| Nation | Areas in the county layer | Structure | Districts below |
|---|---|---|---|
| England | 153 | Mixed: 21 two-tier counties, 132 single-tier authorities | 164 |
| Scotland | 32 | Single tier throughout | 0 |
| Wales | 22 | Single tier throughout | 0 |
| Northern Ireland | 11 | Single tier throughout | 0 |
| United Kingdom | 218 | 164 |
The cleanest proof that Scotland, Wales and Northern Ireland are wholly single-tier is that their areas appear twice, identically, in two different ONS layers. Filter the county layer to S12, W06 and N09 and you get 32, 22 and 11 codes. Filter the district layer the same way and you get the same 32, 22 and 11 codes, character for character. A council area is its own county and its own district at once.
England is where the arithmetic gets interesting: 153 areas break down as 21 county councils plus 63 unitary authorities, 36 metropolitan districts and 33 London boroughs. Those last 132 are single-tier, so the number of areas with districts beneath them is 21, holding 164 districts between them.
Four code families make up England's 153
GSS codes are not opaque: the prefix names the kind of body.
| Prefix | Count | What it is | Below it |
|---|---|---|---|
E10 | 21 | County council | 164 districts, 5 to 12 each |
E06 | 63 | Unitary authority | Nothing |
E08 | 36 | Metropolitan district | Nothing |
E09 | 33 | London borough | Nothing |
S12 | 32 | Scottish council area | Nothing |
W06 | 22 | Welsh principal area | Nothing |
N09 | 11 | Northern Ireland district | Nothing |
Why does the distinction matter outside a civics essay? Because the two kinds of body spend different money. A county council runs social care, highways, schools and libraries. A district runs waste collection, planning, housing benefit and council tax collection. If the indicator on your slide is "adult social care spend per head," it belongs on the 21 counties, and the 132 single-tier authorities each hold that figure for their own area. If it is "households on the waiting list," it is a district figure, and half your map has no number for it at all. There is no national table that gives you both at one level, which is the practical reason the ONS publishes two layers rather than one.
Where the 164 districts actually sit
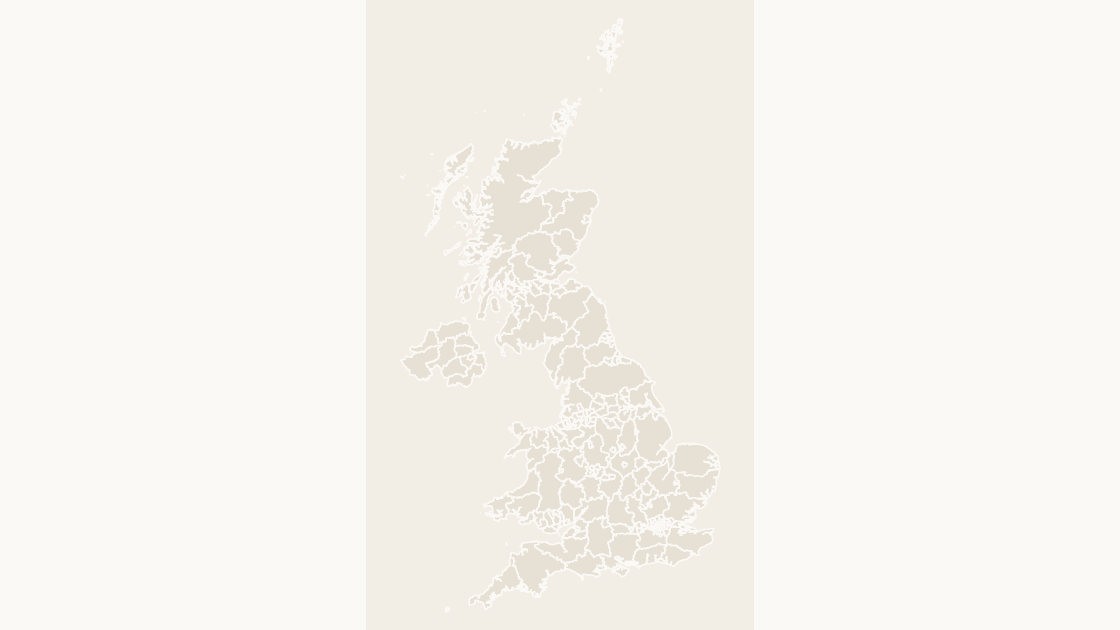
The district layer is bigger than the county layer. It holds 361 areas: the same 21 county councils are absent, their 164 districts are present, and the 197 single-tier authorities appear unchanged. England accounts for 296 of the 361, Scotland 32, Wales 22 and Northern Ireland 11.
The 164 districts are not spread evenly across the 21 counties, and the pattern is historical rather than logical:
| Districts under one county | Counties | Examples |
|---|---|---|
| 12 | 3 | Essex, Kent, Lancashire |
| 11 | 2 | Hampshire, Surrey |
| 10 | 1 | Hertfordshire |
| 8 | 3 | Derbyshire, Devon, Staffordshire |
| 7 | 5 | Leicestershire, Lincolnshire, Norfolk, Nottinghamshire, West Sussex |
| 6 | 2 | Gloucestershire, Worcestershire |
| 5 | 5 | Cambridgeshire, East Sussex, Oxfordshire, Suffolk, Warwickshire |
Five counties carry five districts, three carry twelve, and the median is seven. Each line is the residue of a boundary review, and the reviews happened in different decades.
The code survives the name
Names are the least stable thing in this dataset, which is why the same area can be "Cumbria" on a 2019 slide and two different authorities on a 2026 one. The current release has no Cumbria at all. It has Cumberland (E06000063) and Westmorland and Furness (E06000064). It has no Northamptonshire; it has North Northamptonshire (E06000061) and West Northamptonshire (E06000062). Buckinghamshire survives as a name but changed family, from a two-tier county to a unitary authority (E06000060).
Names also arrive formatted in ways a lookup formula does not expect. Eleven of the 218 carry a comma or a trailing "City of": Kingston upon Hull, City of, Herefordshire, County of, Bristol, City of, City of London, City of Edinburgh. Note that the pattern is not even consistent in direction, since London's is City of London and Hull's is the reverse. A VLOOKUP against a spreadsheet of council names will miss those eleven before it misses anything else.
The within-layer news is better than you might fear: all 218 names in the county layer are unique, and all 361 in the district layer are unique. Unlike US counties, where 443 names repeat across the 3,235 areas, there is no Washington County problem here. Uniqueness is not stability, though. Join on the GSS code and the reorganizations stop mattering. The FIPS and GEOID article covers the same principle on the other side of the Atlantic.
Why the top level is the heavy one
Counties look like bigger shapes, so it is tempting to assume the district file is heavier. It is not. The county layer is 18.8 MB of GeoJSON, compressing to 7.1 MB; the district layer is larger still, because splitting a county into five pieces multiplies the coastline it has to describe.
Within the 218, the weight is extremely uneven. The 482,398 vertices have a median of 602 per area, and the extremes are two orders of magnitude apart:
Highland(S12000017): 46,123 vertices across 722 separate polygons.Na h-Eileanan Siar(S12000013): 44,583 vertices across 1,417 polygons.City of London(E09000001): 67 vertices across 2 polygons.
Eighty-seven of the 218 areas are multipolygons, meaning islands and detached parishes are carried as one feature with many parts. That is the right choice for a boundary file and the right choice for a slide: PowerPoint receives 218 shapes, not 218 plus a few thousand fragments. The county deck on this site puts all 218 on slide 1 inside a single group; the district deck puts 361 there. One click selects the map, a second click selects an area.
Pick the level before you fill anything
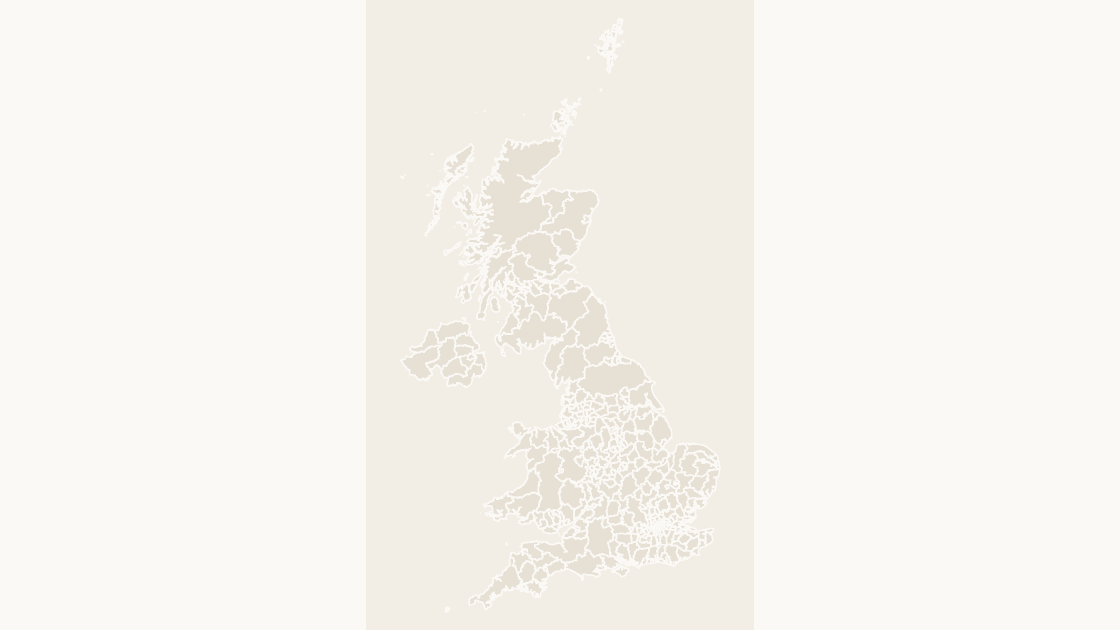
The choice is made by the data, not by the aesthetics. Work backwards from the column you have.
| What the slide has to show | Layer to use | Shapes |
|---|---|---|
| Adult social care, highways, schools, library spend | Counties and unitary authorities | 218 |
| Waste collection, planning applications, housing benefit | Local authority districts | 361 |
| Constituency results or electoral swing | Parliamentary constituencies | 650 |
| Regional totals, levelling-up funding | Regions (England only) | 9 |
One warning that costs people an afternoon: you cannot average district rates into a county rate. A county figure is a population-weighted aggregate of its districts, and most published rates are already per 1,000 people or per household, so a plain mean of five district values is wrong in proportion to how unequal those districts are. Either find the county-level table, or sum the numerators and denominators separately and divide at the end.
Coloring is then a mechanical step: put the GSS code in one column, the value in the next, use XLOOKUP to pull the fill class onto the deck's data slide, and apply it with Shape Format → Shape Fill. With 218 shapes, do it by class rather than by hand. The color walkthrough covers the selection mechanics, and the US county count is the mirror-image case where the tier question does not arise at all.
Choosing the county layer for a district-level indicator does not produce an error, it produces a blank map with 197 filled areas. The shapes exist for every part of the UK, so nothing looks broken until someone asks why half of England is gray.
A five-minute check on the numbers
Every figure above comes out of the two GeoJSON files, and you can reproduce them before you trust a slide built from them:
import collections, gzip, json

raw = open('data/uk/ctyua.geojson', 'rb').read()
cty = json.loads(raw)['features']
lad = json.load(open('data/uk/lad.geojson', encoding='utf-8'))['features']

print('counties and unitary authorities:', len(cty))
print('by nation:', dict(collections.Counter(f['properties']['nation'] for f in cty)))
print('by code family:', dict(sorted(collections.Counter(
    f['properties']['code'][:3] for f in cty).items())))
print('districts:', len(lad), 'with a county above them:',
      sum(1 for f in lad if f['properties'].get('county_code')))
kids = collections.Counter(f['properties']['county_code']
                           for f in lad if f['properties'].get('county_code'))
print('counties with districts:', len(kids),
      'min/max:', min(kids.values()), max(kids.values()))
print('bytes:', len(raw), 'gzip:', len(gzip.compress(raw, 9)))
counties and unitary authorities: 218
by nation: {'England': 153, 'Northern Ireland': 11, 'Scotland': 32, 'Wales': 22}
by code family: {'E06': 63, 'E08': 36, 'E09': 33, 'E10': 21, 'N09': 11, 'S12': 32, 'W06': 22}
districts: 361 with a county above them: 164
counties with districts: 21 min/max: 5 12
bytes: 18812918 gzip: 7111640The last two lines are the whole article in miniature: 21 areas with children, 164 children, and a spread from 5 to 12 that no formula will predict.
Is a unitary authority a county?
Why does a UK county map have 218 areas?
Does Scotland still have counties?
Should I match my data on the name or the code?
Can I put district data on the county map?
Both levels, already drawn
218 counties and unitary authorities, or 361 districts, each an independent named shape carrying its GSS code. $9.99, one-time download.
See the UK county mapQuestions
Is a unitary authority a county?
Why does a UK county map have 218 areas?
Does Scotland still have counties?
Should I match my data on the name or the code?
Can I put district data on the county map?
Written in-house. Boundary counts are checked against the published files, and every figure on this page can be reproduced from the source named in it.