Slide design·5 min read
Map Resolution for Presentations Is a Pixel Width, Not a DPI
A map slide has no resolution until something exports it, and what comes out is measured in pixels, not dots. Two widths cover nearly every case — 1,920 for a projector, 3,000 for a ten-inch print — and a ninety-second measurement tells you which of your boundaries survived.
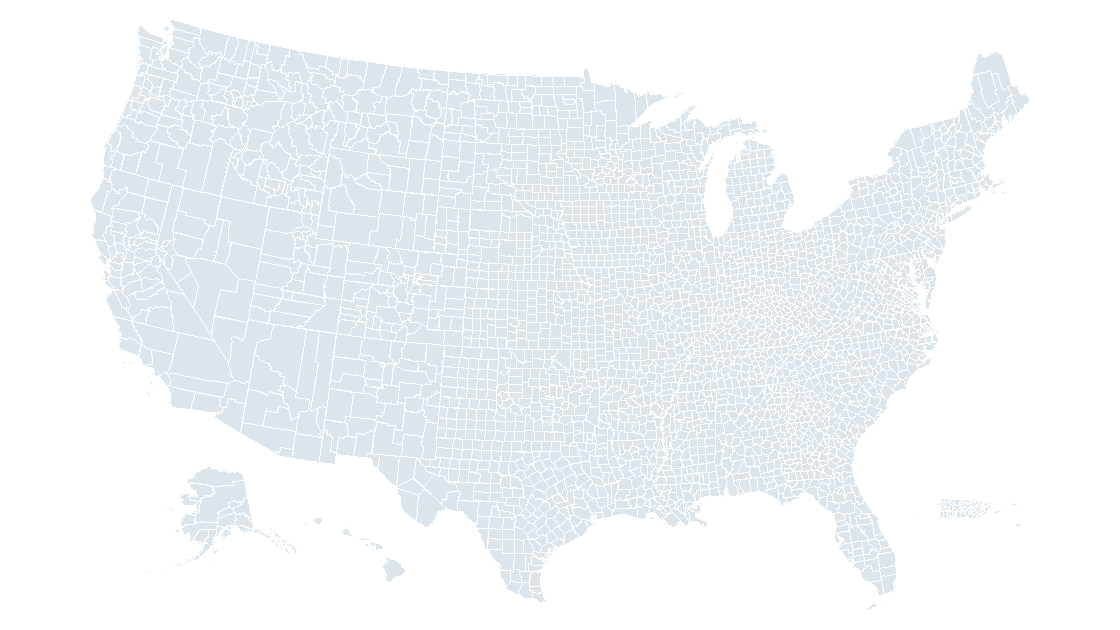
Two widths cover nearly every map slide
A map slide does not have a resolution. It has coordinates: every state, county and district is a closed path stored as integers, and those integers stay integers until something converts them to pixels. So "what resolution should the map be" is really "how wide will the exported image be."
For a projector or a screen share, export 1,920 pixels wide. For a ten-inch-wide print, 3,000. For anything that will be scaled, cropped or printed larger, export a vector format and the question disappears. Everything else — "300 DPI", "high quality", "print ready" — is a route to one of those numbers, and usually the wrong route for the file in front of you.
The slide grid is finer than any export you will make
PowerPoint stores every shape coordinate in EMUs at 914,400 to the inch. A 16:9 slide is 12,192,000 by 6,858,000 of them. A pixel, by comparison, is blunt:
| Export resolution | One pixel covers | Slide comes out |
|---|---|---|
| 96 DPI | 9,525 EMU | 1,280 × 720 |
| 150 DPI | 6,096 EMU | 2,000 × 1,125 |
| 300 DPI | 3,048 EMU | 4,000 × 2,250 |
At 300 DPI one pixel still spans 3,048 coordinate steps. The deck is not the side that is short of detail. The export is.
Three targets, and where each number comes from
| Where the slide ends up | Export width | Equivalent resolution | Why |
|---|---|---|---|
| 1080p projector or screen share | 1,920 px | 144 DPI | One image pixel per screen pixel |
| Ten-inch printed page at 300 DPI | 3,000 px | 225 DPI | 3,000 px across 13.333 in |
| Archive, or crop into a region later | 4,000 px | 300 DPI | Room to crop to a third and still print |
| Scaled on a wall, or into a print PDF | Vector (EMF, SVG) | — | No raster grid to run out of |
The first row is the one that gets missed, in both directions. A 1080p projector paints 1,920 pixels across a 13.333-inch slide, so it resolves the deck at 144 DPI — not 96, not 300. Export at 96 and you hand it 1,280 pixels to stretch by 1.5×; export at 300 and you hand it 4,000 pixels, of which 2,080 never reach the lens. Extra pixels are file size in someone's inbox and time in a PDF.
The second row is subtler. A ten-inch page at 300 DPI needs 3,000 pixels across. Spread over the 13.333-inch slide, that is an export at 225 DPI, not 300. Asking for 300 DPI for print overshoots by a third — harmless, and also why the slogan never quite matches the arithmetic.
What 3,225 county shapes do at each width
In the county template, slide 1 carries 3,225 freeform shapes and the map occupies 5.85 by 3.70 inches. Walk every boundary path and there are 47,865 segments; the median one is 0.0105 inch long, a little over a quarter of a millimetre.
| Export | Map width in the image | Median segment | Segments under one pixel |
|---|---|---|---|
| 96 DPI (1,280 px) | 562 px | 1.01 px | 23,751 — 49.6% |
| 150 DPI (2,000 px) | 878 px | 1.58 px | 15,888 — 33.2% |
| 300 DPI (4,000 px) | 1,755 px | 3.15 px | 6,770 — 14.1% |
At 96 DPI, half the boundary detail in the file is shorter than a pixel. Adjacent vertices land on the same pixel and the renderer keeps one of them; that is what losing a coastline actually means. At 300 DPI the median segment is three pixels and the shapes hold — yet 14 percent of segments are still sub-pixel, and more resolution will not recover them, because the limit is no longer the raster.
County width says the same thing from the other side. The median county is 0.0621 inch across: 5.96 pixels at 96 DPI, 18.6 at 300. Twenty-two counties are narrower than one pixel at 96 DPI, six at 150, none at 300. The smallest is 0.0044 inch — 0.42 pixels at 96, a smudge with a name.
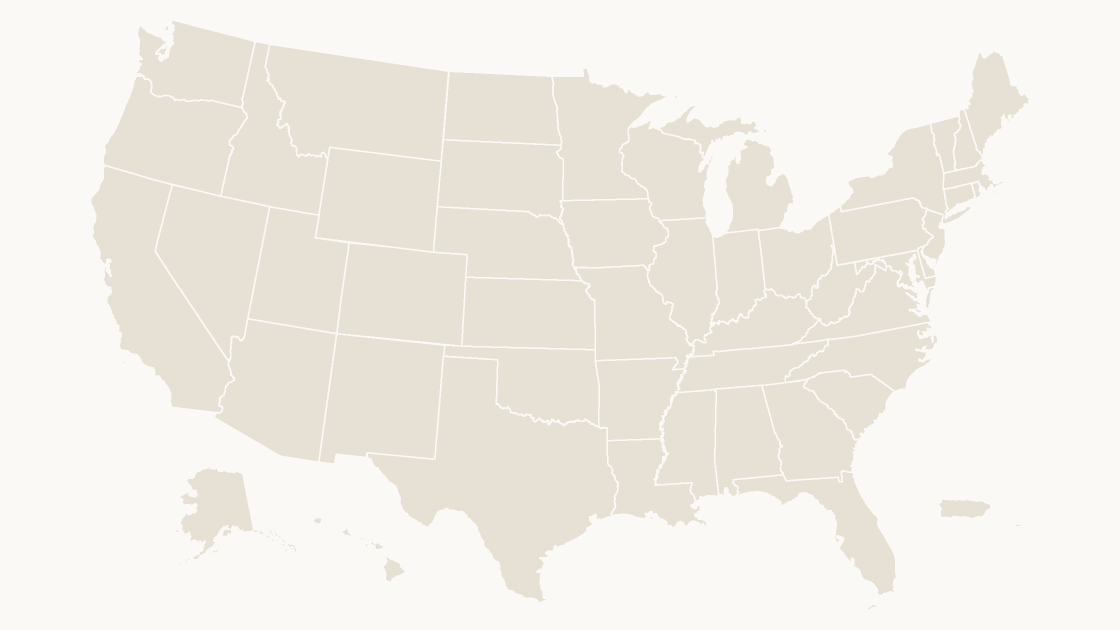
Measuring the file in front of you
Rather than trust a dialog, read the deck. A .pptx is a zip, each shape's path is a list of integer points, and a path's own coordinate space has to be scaled to the shape's extent before lengths mean anything:
import math, re, statistics, zipfile

def segments(deck):
    xml = zipfile.ZipFile(deck).read('ppt/slides/slide1.xml').decode()
    shapes = [s for s in re.findall(r'<p:sp>.*?</p:sp>', xml, re.S)
              if '<a:custGeom>' in s]
    out = []
    for s in shapes:
        cx, cy = map(int, re.search(r'<a:ext cx="(\d+)" cy="(\d+)"/>', s).groups())
        w, h = map(int, re.search(r'<a:path [^>]*w="(\d+)" h="(\d+)"', s).groups())
        sx, sy = cx / w, cy / h            # path space -> EMU
        for path in re.findall(r'<a:pathLst>(.*?)</a:pathLst>', s, re.S):
            pts = [(int(a) * sx, int(b) * sy) for a, b
                   in re.findall(r'<a:pt x="(-?\d+)" y="(-?\d+)"/>', path)]
            for a, b in zip(pts, pts[1:]):
                d = math.hypot(b[0] - a[0], b[1] - a[1])
                if d:
                    out.append(d / 914400)     # inches on the slide
    return len(shapes), sorted(out)

n, segs = segments('dist/us-counties--slate.pptx')
print(f'{n} shapes, {len(segs)} segments, median {statistics.median(segs):.4f} in')
for dpi in (96, 150, 300):
    under = sum(1 for s in segs if s * dpi < 1)
    print(f'{dpi:4d} dpi  median {statistics.median(segs) * dpi:5.2f} px  '
          f'under 1 px: {under} ({under / len(segs):5.1%})')
3225 shapes, 47865 segments, median 0.0105 in
96 dpi median 1.01 px under 1 px: 23751 (49.6%)
150 dpi median 1.58 px under 1 px: 15888 (33.2%)
300 dpi median 3.15 px under 1 px: 6770 (14.1%)Two details in that output are worth keeping. The count is 3,225, not the 3,235 features in the source data, because a few counties are stored as one merged shape and the eight text boxes on the slide are not geography. And the sx, sy scaling cannot be skipped: a path is written in its own units, and ignoring the conversion inflates lengths by whatever ratio the shape happens to use — in the state deck that ratio runs as high as 7.4.
The 1,120-pixel habit, and the 1.71× that gives it away
Most soft maps on slides were not exported badly. They were never exported: something was pasted in. A screenshot of a web map, a thumbnail, a PNG pulled off a data portal — the pixel width is whatever the page happened to be.
The thumbnails on this site are 1,120 pixels wide, which is generous for a card and thin for a slide. Stretch one across a 13.333-inch slide and it is 84 pixels per inch. On a 1,920-pixel projector it gets upscaled 1.71×, and every boundary line is interpolated into a soft gray ramp along the way. The same image at 2,560 pixels — a 2× retina capture — lands at 192 pixels per inch and looks clean on screen; it is still short of the 3,000 a printed page wants.
The check is division, not judgement. Image width in pixels ÷ slide width in inches = pixels per inch. 1,120 ÷ 13.333 = 84. If the answer is below 144 the projector is doing the work; below 225 and print will show it.
A larger export does not fix a paste. If the map on your slide is a bitmap, the pixels in that bitmap are the ceiling — exporting the slide at 300 DPI only resamples it. Replace it with shapes first, or re-export the map from its source at the target width.
Where more pixels stop buying anything
The curve has a flat top. Going from 96 to 300 DPI takes sub-pixel segments from 49.6 percent down to 14.1 percent; going from 300 to 600 only moves the remaining 14 percent closer to a pixel they never quite reach. Past that point the export is describing the raster grid, not the map.
That matters because the cost is real: pixel count grows as the square of the width, so 4,000 px wide is 9,000,000 pixels against 921,600 at 1,280. For a file that will be projected for eight seconds, the difference is a slower upload and nothing on the screen.
The handoff, when the slide leaves the deck
For a printer, a poster or anything that will be resized after it leaves you, export vector. In PowerPoint for Windows, right-click the slide in the thumbnail pane, Save as Picture, and choose EMF or — in Microsoft 365 — SVG; both keep the paths and the fills. A bitmap format in that same list inherits whatever the export resolution is set to, and the dialog will not tell you what that is, so open the result and read its dimensions instead of assuming.
In Keynote, File → Export To → Images offers a scale rather than a resolution, and 1× is the slide at 1,920 pixels wide; the 2× and 3× options are the print and crop answers. Either way the deck itself is already the highest-resolution copy that exists: copying the slide across beats exporting it, and the same logic applies to Keynote files that need to come back out.
The templates ship as shapes precisely so that resolution stays a decision you make per destination rather than a property baked in at purchase: 3,235 county shapes, each one recolorable, or the fifty-state set when the county layer is more detail than the export can carry. If the palette is the open question instead, the color test is the next file to read.
What resolution should I export a map slide at?
Why is an exported map blurrier than the slide looked?
Is 300 DPI always the safe choice?
How do I check a map before sending it?
Start with shapes, not a screenshot
3,235 county shapes at 914,400 units per inch, so every export width is your choice and none of them are upscaled. $9.99, one-time download.
See the county mapQuestions
What resolution should I export a map slide at?
Why is an exported map blurrier than the slide looked?
Is 300 DPI always the safe choice?
How do I check a map before sending it?
Written in-house. Boundary counts are checked against the published files, and every figure on this page can be reproduced from the source named in it.