 $19.99
London
London Boroughs
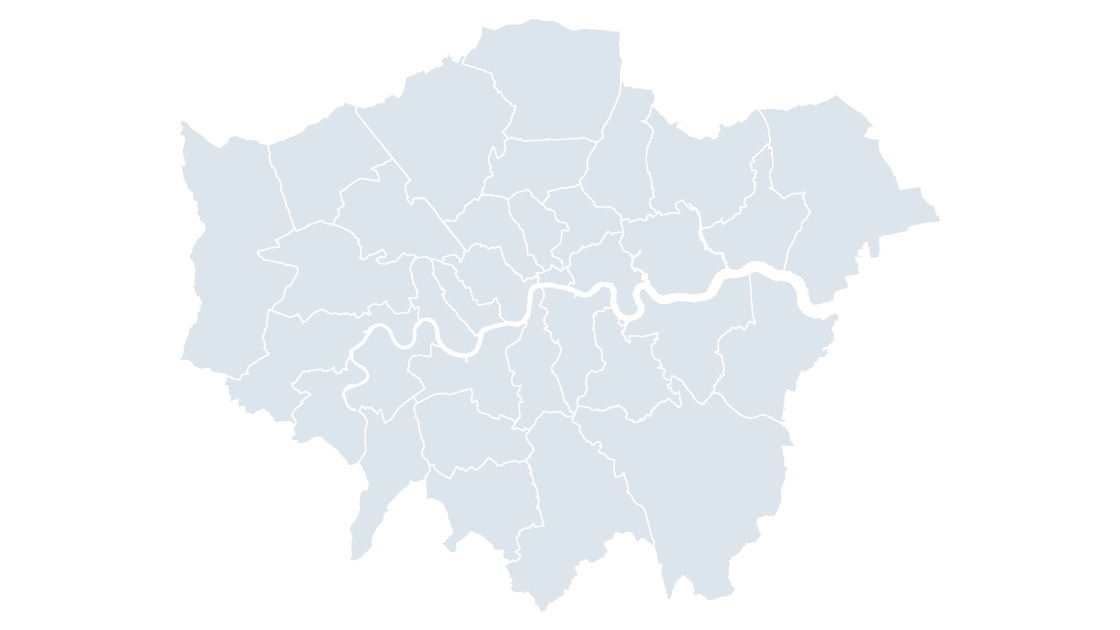
Greater London as 33 editable shapes — the 32 boroughs and the City of London.
33 London authorities
235 KB
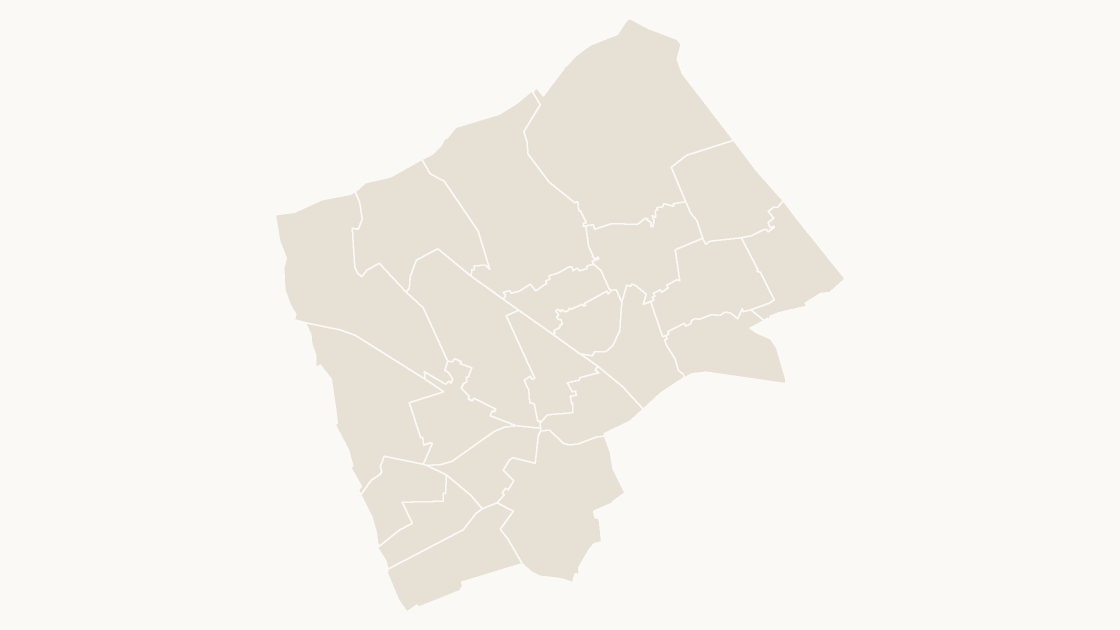
Preview shows the map slide in Editorial, Mono, Slate.
Office for National Statistics licensed under the Open Government Licence v.3.0; contains OS data © Crown copyright and database right 2026.
All 22 wards of Harrow.
Download a free sample deck — England Integrated Care Boards, all three themes, no email and no card.
One-time payment · 3 .pptx files, all themes included · 14 days refund policy · Terms and Privacy
The 22 wards of Harrow as editable shapes, each with its GSS code, with the borough outline included for context.
Typical use: Ward-level coverage and local reporting in Harrow.
All 22 wards are in the file:
Belmont, Canons, Centenary, Edgware, Greenhill, Harrow on the Hill, Harrow Weald, Hatch End, Headstone, Kenton East, Kenton West, Marlborough, North Harrow, Pinner, Pinner South, Rayners Lane, Roxbourne, Roxeth, Stanmore, Wealdstone North, Wealdstone South, West Harrow.
| Price | $19.99, one-time payment, no subscription |
|---|---|
| Format | PowerPoint .pptx, opens natively in Keynote |
| File size | 57 KB |
| Join field | GSS code (the ONS identifier for each area) |
| Area figures | Area, km², measured from the boundary geometry |
| Boundary source | Office for National Statistics, Open Government Licence v3.0 |
| Projection | Albers equal-area conic, fitted to the UK |
| Coordinates | WGS84 longitude / latitude |
| Licence | Commercial use permitted; resale of the files is not |
| Refunds | Full refund within 14 days for any reason, and at any time if the file is defective or not as described |
$19.99
Greater London as 33 editable shapes — the 32 boroughs and the City of London.
 $19.99
 $19.99