GeoSlides
Market: United Kingdom
Browse templates
United Kingdom/ Templates/London Boroughs
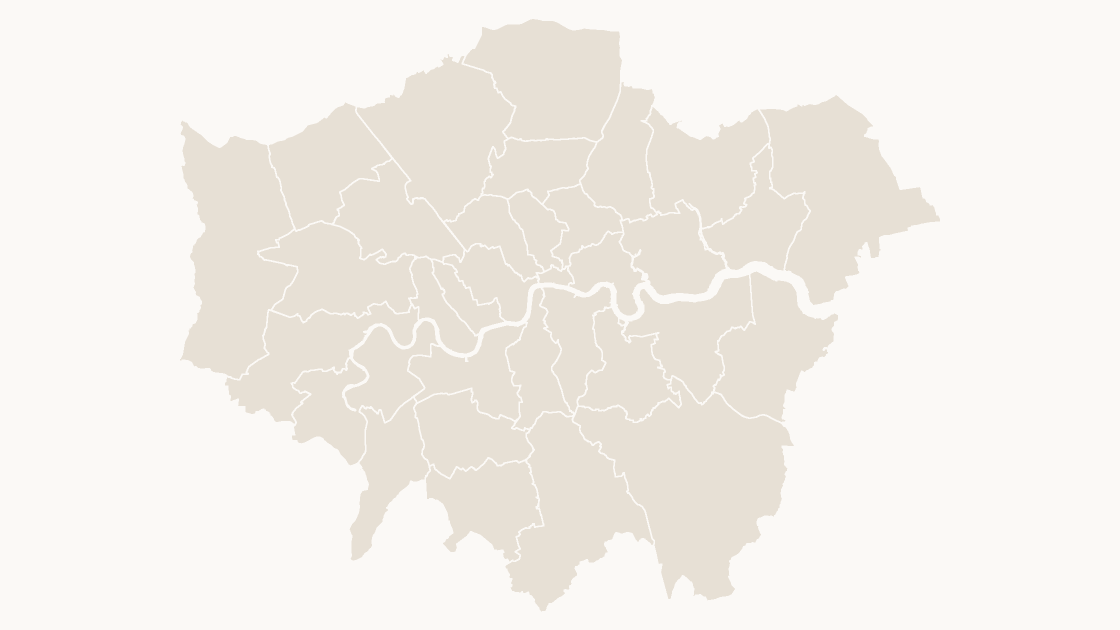
London Boroughs map preview in the editorial theme

Preview shows the map slide in Editorial, Mono, Slate.

Every template has the same eight slides

  1. Cover — the map's name and theme, on a slide you can put your own title over.
  2. Editing guide — ungroup, recolour, regroup, in three steps and without plugins.
  3. The map — every area at one flat colour, the blank starting point for your own shading.
  4. Reference map — all 33 London authorities named, each carrying its GSS code, so nothing has to be looked up.
  5. Data map — five shaded classes and a legend, ready for your own figures instead of the sample ones.
  6. Spotlight — the largest few by area emphasised and the rest muted, for a single clear point.
  7. Working with the data — a data hand-off table.
  8. Source and licence — the boundary release, the publisher and the licence, printed on the slide so the deck carries its own provenance.

Office for National Statistics licensed under the Open Government Licence v.3.0; contains OS data © Crown copyright and database right 2026.

$19.99 · all three themes London

Editable London Boroughs Map Template

Greater London as 33 editable shapes — the 32 boroughs and the City of London.

How to edit

Download a free sample deck — England Integrated Care Boards, all three themes, no email and no card.

One-time payment · 3 .pptx files, all themes included · 14 days refund policy · Terms and Privacy

33 London authoritiesGeography
33Editable shapes
8Slides
3Themes
About this template

Greater London as its 33 authorities — the 32 boroughs plus the City of London — each with its GSS code. The City of London is not a borough, and several boroughs share a name with a parliamentary constituency that covers a different area, so the code is the field to join on.

Typical use: London coverage, catchment and service-area maps, and any figure the boroughs publish about themselves.

How teams use it

  • Borough coverage — Show service coverage, catchment or performance across the boroughs, each one a shape you can fill or label on its own.
  • Local reporting — A borough-level map that matches how London data is published, for a committee paper or a public report.
  • Comparing inner and outer — Group boroughs by any definition the argument needs, without redrawing boundaries.

Purchase terms

  • $19.99, one-time payment. There is no subscription and no further charge.
  • Immediate delivery. The download link is issued as soon as payment is confirmed. It keeps working, and a fresh one can be fetched at any time from the find-my-download page.
  • 14 days refunds. A refund may be requested within 14 days for any reason, whether or not the file has been downloaded. See the refund policy.
  • Commercial use. Use in any number of presentations, commercial or internal. Resale or redistribution of the file is not permitted.
  • Credit. The Open Government Licence requires the two credit lines wherever the boundaries are reproduced. Both are already on the source slide of every deck.
  • Payment. Handled by Waffo Pancake as merchant of record, which also collects any applicable tax.
Areas included

All 33 London authorities are in the file:

Barking and Dagenham, Barnet, Bexley, Brent, Bromley, Camden, City of London, Croydon, Ealing, Enfield, Greenwich, Hackney, Hammersmith and Fulham, Haringey, Harrow, Havering, Hillingdon, Hounslow, Islington, Kensington and Chelsea, Kingston upon Thames, Lambeth, Lewisham, Merton, Newham, Redbridge, Richmond upon Thames, Southwark, Sutton, Tower Hamlets, Waltham Forest, Wandsworth, Westminster.

Specification
Price$19.99, one-time payment, no subscription
FormatPowerPoint .pptx, opens natively in Keynote
File size235 KB
Join fieldGSS code (the ONS identifier for each area)
Area figuresArea, km², measured from the boundary geometry
Boundary sourceOffice for National Statistics, Open Government Licence v3.0
ProjectionAlbers equal-area conic, fitted to the UK
CoordinatesWGS84 longitude / latitude
LicenceCommercial use permitted; resale of the files is not
RefundsFull refund within 14 days for any reason, and at any time if the file is defective or not as described
Questions

London Boroughs — questions before you buy

How is this different from the map chart built into PowerPoint?
The map chart built into Microsoft 365 and Office 2019 or later looks places up through Bing Maps and stops at country level for the UK, so it cannot draw local authority districts, council areas or wards. These maps are ordinary PowerPoint shapes built from the ONS boundary files: nothing is looked up, every level below country is covered, and any area can be recoloured, relabelled or deleted on its own.
What does this London borough map show?
This is the London borough map. 33 London authorities — all in England. Every one is a separate shape that can be filled, labelled or deleted on its own, and the same boundaries are used on the map, the labelled reference slide and the data slide, so nothing shifts between them.
Does this include the City of London?
Yes — which is why the count is 33 rather than 32. The City of London is a separate authority with its own boundaries and its own wards, and leaving it out would put a hole in the middle of a Greater London map.
What kind of data can I show on this map?
Anything published at London borough level: housing, business rates, air quality, public health, local election results. Classify your figures into five bands and recolour by class — the data slide is already a five-step legend you can keep or replace — and the data hand-off slide lists every GSS code against its area name, ready to paste your figures next to.
How do I link my own data to the map?
Each shape is named after its area and carries its ONS GSS code, the identifier statistics are published against. Every code here begins E09, the ONS prefix for London boroughs. Join on the code rather than on names: authority names repeat across the UK, get respelt by different publishers, and change when councils reorganise, while the code stays with the area.
Which boundary release is this based on?
Office for National Statistics boundaries, May 2026 release, generalised and clipped to the coastline. They are published under the Open Government Licence, which permits commercial use and requires two credit lines wherever the material is reproduced — both are already printed on the source slide of every deck.
Is there a wider or a more detailed map of this area?
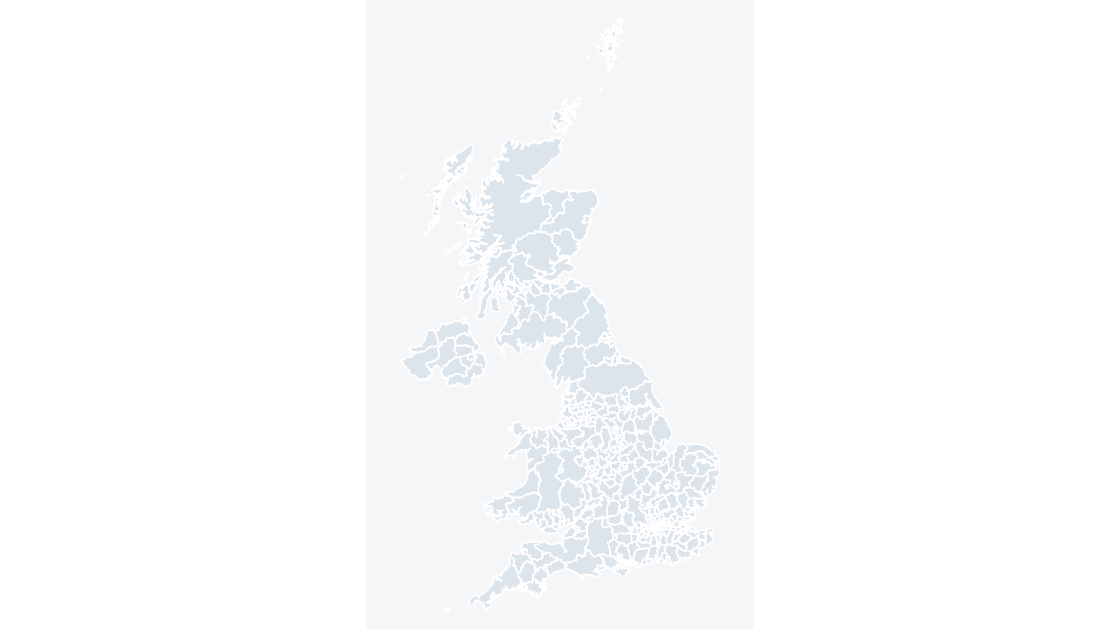
The United Kingdom Local Authority Districts map is the wider view. Every borough and the City of London has its own ward map — Barking and Dagenham Wards, Barnet Wards, Bexley Wards and Brent Wards and 29 more in the catalogue.
Who uses these maps?
Local government and public sector analysts, NHS and police planning teams, consultants and market researchers, property and site-selection teams, campaign and public affairs staff, and anyone who needs a UK map in a report, a bid or a presentation.
Does it work in Google Slides?
Yes. Upload the .pptx to Drive and open it with Google Slides. The files contain only shapes, solid fills and Arial, and no animation, SmartArt, chart or embedded media, which are the elements an importer drops or converts.
Can I print the map?
Yes. The artwork is vector, so a map stays sharp at poster size, and the themes are built so that the lightest shade still separates from the slide background in print.
Keep exploring

Related UK templates

Barnet Wards map preview $19.99
London

Barnet Wards

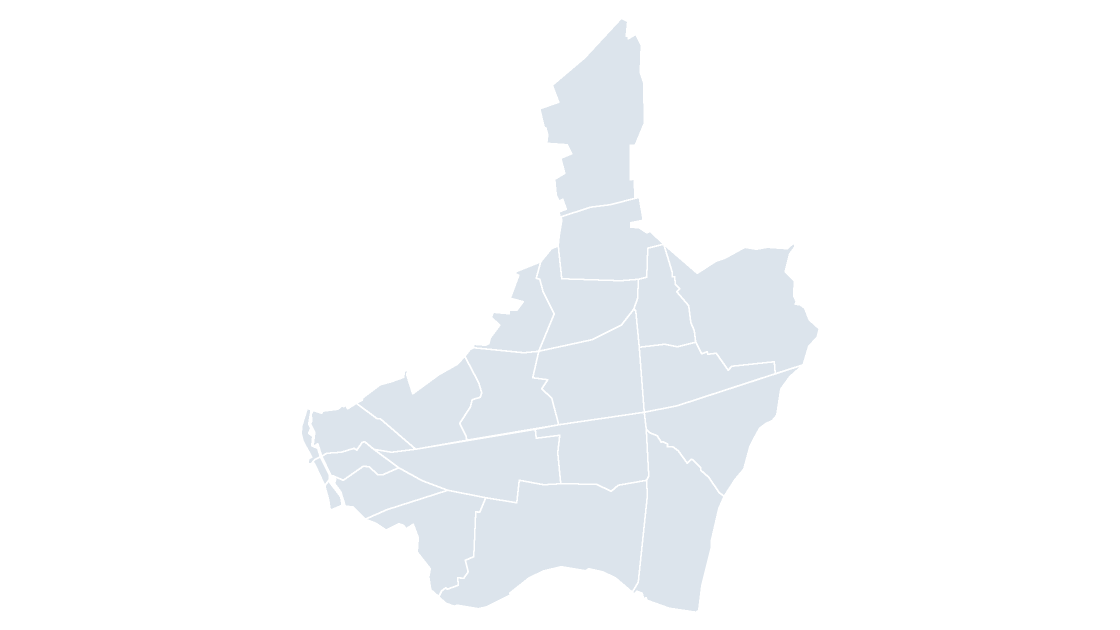
All 24 wards of Barnet.

24 wards 73 KB