GeoSlides
Market: Spain
Browse templates
Spain/ Templates/Spain Provinces
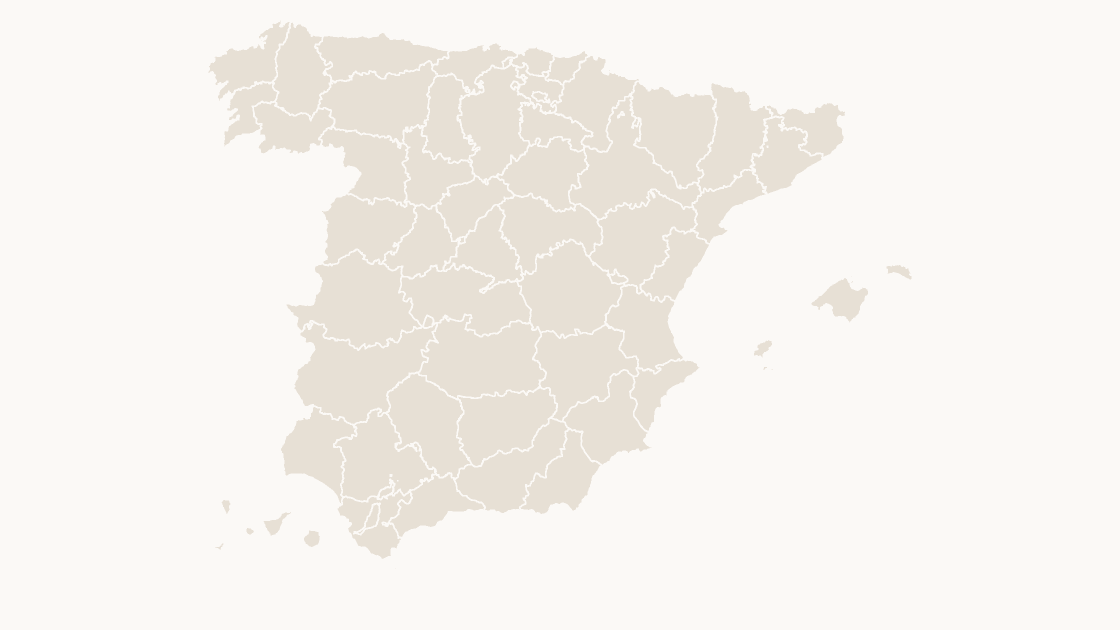
Spain Provinces map preview in the editorial theme

Preview shows the map slide in Editorial, Mono, Slate

Every template has the same eight slides

  1. Cover — the map's name and theme, on a slide you can put your own title over.
  2. Editing guide — ungroup, recolor, regroup, in three steps and without plugins.
  3. The map — every area at one flat color, the blank starting point for your own shading.
  4. Reference map — all 52 provinces named, each carrying its national code, so nothing has to be looked up.
  5. Data map — five shaded classes and a legend, ready for your own figures instead of the sample ones.
  6. Spotlight — the largest few by area emphasised and the rest muted, for a single clear point.
  7. Working with the data — a data hand-off table.
  8. Source and license — the boundary release, the publisher and the license, printed on the slide so the deck carries its own provenance.

Centro Nacional de Información Geográfica (CNIG), Instituto Geográfico Nacional. Boundaries registered in the Registro Central de Cartografía.

$19.99 · all three themes Provinces

Editable Spain Provinces Map Template

All 52 provinces, with the municipal borders drawn over the top.

How to edit

Download a free sample deck — Spain Autonomous Communities, all three themes, no email and no card.

One-time payment · 3 .pptx files, all themes included · 14 days refund policy · Terms and Privacy

52 provincesGeography
52Editable shapes
8Slides
3Themes
About this template

The 52 provinces of Spain as editable shapes, each carrying its INE code. Municipal borders run across the map as context lines, so the level every Spanish dataset actually uses stays visible while the provinces are colored. The two autonomous cities, Ceuta and Melilla, count as provinces in every official table and are drawn that way here.

Typical use: Provincial reporting, market sizing by province, and any figure the INE publishes at provincia level.

How teams use it

  • Regional comparison — Compare provinces on one slide, with each boundary a separate shape so the contrast can be as coarse or as detailed as the argument.
  • Distribution and logistics — Show depots, routes and catchment by province, the unit that regional operations are usually planned in.
  • Reporting — A province-level map that matches the way regional statistics are published, so the slide and the table agree.

Purchase terms

  • $19.99, one-time payment. There is no subscription and no further charge.
  • Immediate delivery. The download link is issued as soon as payment is confirmed. It keeps working, and a fresh one can be fetched at any time from the find-my-download page.
  • 14 days refunds. A refund may be requested within 14 days for any reason, whether or not the file has been downloaded. See the refund policy.
  • Commercial use. Use in any number of presentations, commercial or internal. Resale or redistribution of the file is not permitted.
  • Credit. Order FOM 2807/2015 requires the origin of the data to be acknowledged and the data date stated. Both are already on the source slide of every deck.
  • Payment. Handled by Waffo Pancake as merchant of record, which also collects any applicable tax.
Areas included

All 52 provinces are in the file:

A Coruña, Alacant/Alicante, Albacete, Almería, Araba/Álava, Asturias, Badajoz, Barcelona, Bizkaia, Burgos, Cantabria, Castelló/Castellón, Ceuta, Ciudad Real, Cuenca, Cáceres, Cádiz, Córdoba, Gipuzkoa, Girona, Granada, Guadalajara, Huelva, Huesca, Illes Balears, Jaén, La Rioja, Las Palmas, León, Lleida, Lugo, Madrid, Melilla, Murcia, Málaga, Navarra, Ourense, Palencia, Pontevedra, Salamanca, Santa Cruz de Tenerife, Segovia, Sevilla, Soria, Tarragona, Teruel, Toledo, Valladolid, València/Valencia, Zamora, Zaragoza, Ávila.

Specification
Price$19.99, one-time payment, no subscription
FormatPowerPoint .pptx, opens natively in Keynote
File size606 KB
Join fieldnational code (the CNIG national code for each area)
Area figuresArea, km², measured from the boundary geometry
Boundary sourceCentro Nacional de Información Geográfica (CNIG), Administrative units, Registro Central de Cartografía
ProjectionAlbers equal-area conic, with an inset for the Canary Islands
CoordinatesWGS84 longitude / latitude
LicenseCommercial use permitted; resale of the files is not
RefundsFull refund within 14 days for any reason, and at any time if the file is defective or not as described
Questions

Spain Provinces — questions before you buy

How is this different from the map chart built into PowerPoint?
The map chart built into Microsoft 365 looks places up through Bing Maps and stops at country level for Spain, so it cannot draw provinces or municipalities. These maps are ordinary PowerPoint shapes built from the CNIG boundary files: nothing is looked up, every level below country is covered, and any area can be recolored, relabelled or deleted on its own.
What does this map show?
All 52 provinces of Spain — the 50 on the mainland and the Balearics plus the two autonomous cities, Ceuta and Melilla, which count as provinces in every official table. The municipal borders run across the map as context lines.
Are Ceuta and Melilla included?
Yes, and they are drawn the way every official table counts them: as provinces. They are 20 km across, so at the scale the peninsula needs they are two dots on the African coast — which is how commercial Spain maps draw them, and the copy on the map says where they are. The sovereign rocks off the Moroccan coast belong to no province and are not drawn.
Why are the borders of the level below drawn on the map?
Because they carry the data. The municipal borders run across the map as context lines while the level above is colored, so a figure published per municipality can be read against the shape being highlighted without a second map. They are lines, not shapes: ungrouping the map never mixes the two levels.
What kind of data can I show on this map?
Anything published at province level: provincial GDP, INE population figures, market sizing by province, electoral results. Classify your figures into five bands and recolor by class — the data slide is already a five-step legend you can keep or replace — and the data hand-off slide lists every national code against its area name, ready to paste your figures next to.
How do I link my own data to the map?
Each shape is named after its area and carries the CNIG national code, the identifier Spanish statistics are published against. The code embeds the INE code — a municipality's five digits begin with its province's two — so the levels nest without a lookup table. Join on the code rather than on names: several provinces reuse municipality names, and the code stays with the area through reorganisations and renamings.
Which boundary release is this based on?
Centro Nacional de Información Geográfica (CNIG) boundaries, inscribed in the Registro Central de Cartografía — the register Royal Decree 1545/2007 requires provincial, autonomous-community and municipal boundary lines to be entered in. Retrieved 20 October 2026. Reused under Order FOM 2807/2015, which permits commercial use and requires the origin of the data to be acknowledged; the credit is already printed on the source slide of every deck.
Is there a wider or a more detailed map of this area?
The Spain Autonomous Communities map is the wider view. The finer level is sold separately — A Coruña Municipalities, Alicante Municipalities, Albacete Municipalities, Almería Municipalities and 47 more in the catalog.
Does it work in Keynote and Google Slides?
Both. The files contain only shapes, solid fills and Arial — no animation, SmartArt, chart or embedded media — so Google Slides imports them without dropping anything and Keynote converts each map into a group of editable shapes.
Is the area figure on the data slide official?
No, and it is labeled to say so. CNIG publishes no land-area attribute, so the figure is measured from the boundary geometry itself. Use it to sanity-check your own numbers; for official areas, use the INE figures.
What does it cost, and are refunds available?
Each template costs $19.99 as a one-time payment, with no subscription. A refund may be requested within 14 days days for any reason, whether or not the file has been downloaded, and will be approved.
Keep exploring

Related Spain templates

Spain Autonomous Communities map preview $19.99
Autonomous communities

Spain Autonomous Communities

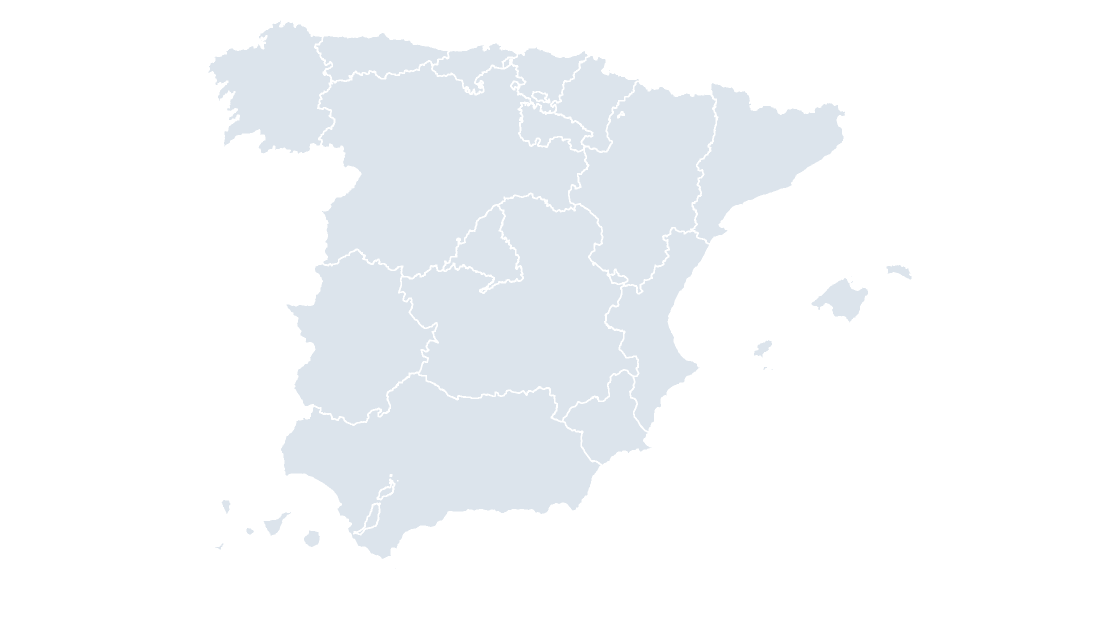
The 19 autonomous communities as editable shapes, with the provincial borders drawn over the top.

19 autonomous communities 388 KB
Andalusia Provinces map preview $19.99
Provinces

Andalusia Provinces

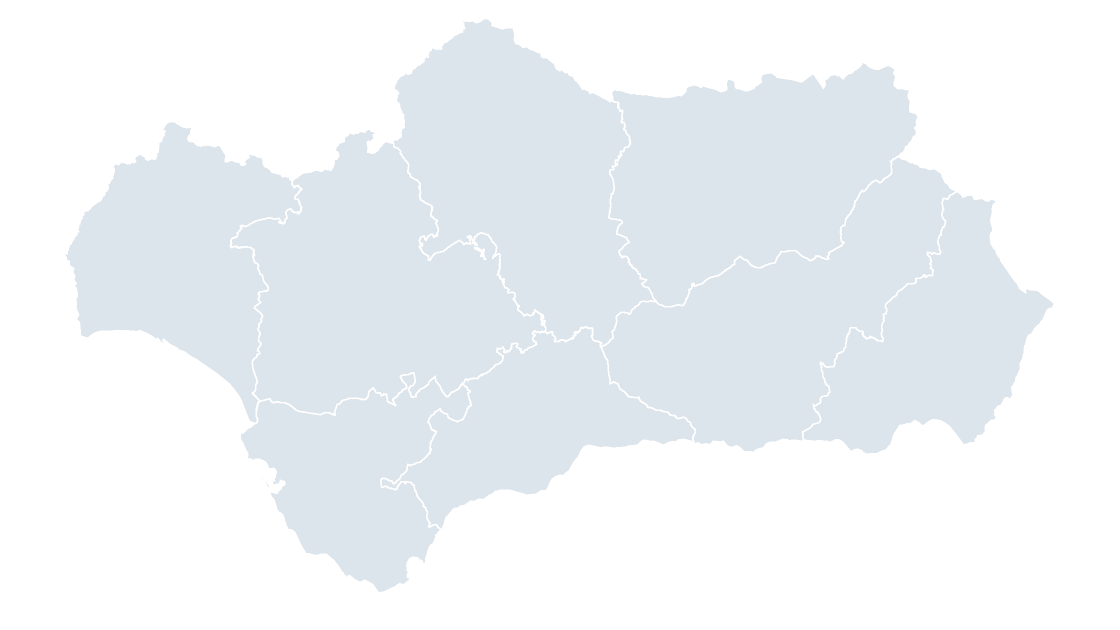
Andalusia — eight provinces in the Guadalquivir basin, the largest community by population
8 provinces 173 KB
Aragon Provinces map preview $19.99
Provinces

Aragon Provinces

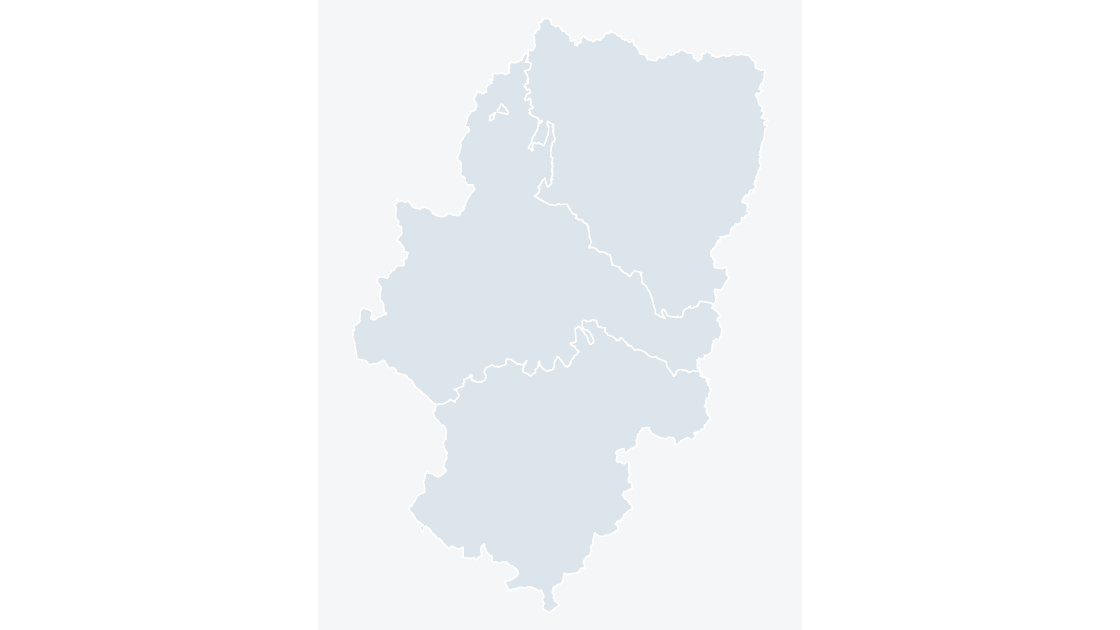
Aragon — three provinces spanning the Ebro valley and the Pyrenean axis

3 provinces 123 KB