GeoSlides
Market: China
Browse templates
China/ Templates/Guangxi Zhuang Autonomous Cities
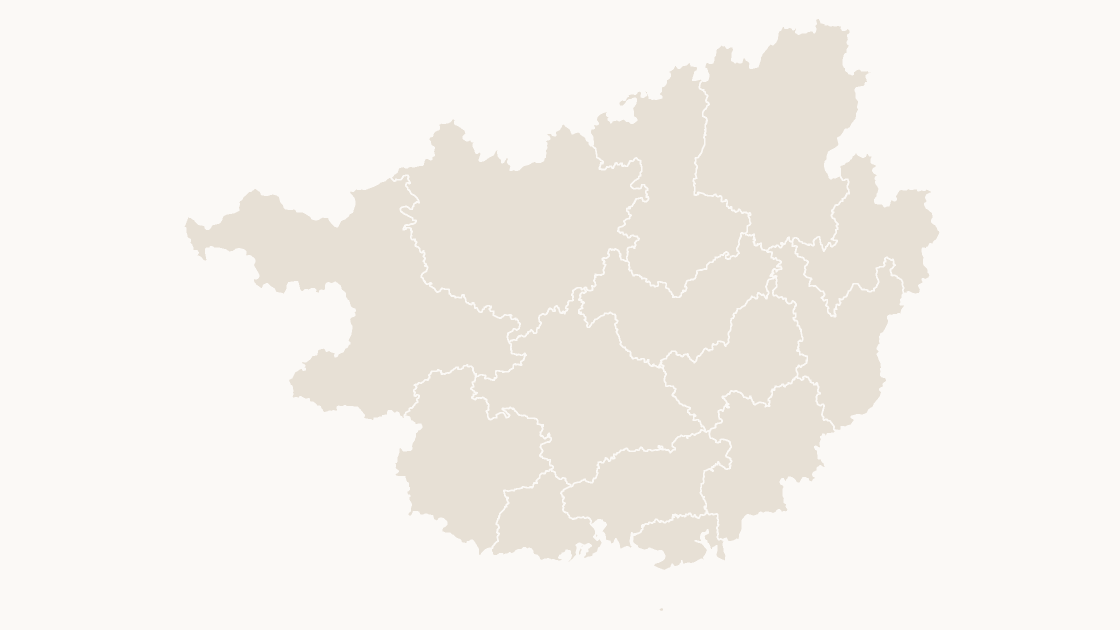
Guangxi Zhuang Autonomous Cities map preview

Preview shows the map slide in Editorial, Mono, Slate.

Every template has the same eight slides

  1. Cover — the map's name and theme, on a slide you can put your own title over.
  2. Editing guide — ungroup, recolor, regroup, in three steps and without plugins.
  3. The map — every area at one flat color, the blank starting point for your own shading.
  4. Reference map — all 14 prefecture-level cities named, each carrying its GB code, so nothing has to be looked up.
  5. Data map — five shaded classes and a legend, ready for your own figures instead of the sample ones.
  6. Spotlight — the largest few by area emphasised and the rest muted, for a single clear point.
  7. Working with the data — the full code table on the slide, ready to paste your figures against.
  8. Source and license — the boundary release, the publisher and the license, printed on the slide so the deck carries its own provenance.
$19.99 · all three themes Provinces

Editable Guangxi Zhuang Autonomous Cities Map Template

The 14 prefecture-level cities of Guangxi Zhuang Autonomous Region as separate shapes, sized for a slide rather than a wall.

How to edit Download a free sample

One-time payment · 3 .pptx files, all themes included · 14 days refund policy · Terms and Privacy

One deck, three themes, no email and no card. The file is the real template, so you can ungroup it, recolor a shape and check that it behaves before buying anything.

14 prefecture-level citiesGeography
14Editable shapes
8Slides
3Themes
About this template

The 14 prefecture-level cities of Guangxi Zhuang Autonomous Region, in China, drawn from the national boundary set. Each city is one shape, so a regional split can follow the administrative lines that the statistics already use instead of hand-drawn areas.

Typical use: Regional comparison within Guangxi Zhuang Autonomous Region, sales or service coverage, and any figure published per city.

How teams use it

  • Regional comparison — Compare provinces on one slide, with each boundary a separate shape so the contrast can be as coarse or as detailed as the argument.
  • Distribution and logistics — Show depots, routes and catchment by province, the unit that regional operations are usually planned in.
  • Reporting — A province-level map that matches the way regional statistics are published, so the slide and the table agree.

Purchase terms

  • $19.99, one-time payment. No subscription and no further charge.
  • Immediate delivery. The link is issued when payment is confirmed and keeps working.
  • 14 days refunds. Requested for any reason, downloaded or not.
  • Commercial license. Any number of presentations; resale of the files is not permitted.
Specification
Price$19.99, one-time payment, no subscription
FormatPowerPoint .pptx, opens natively in Keynote
File size276 KB
Join fieldGB code (the GB administrative code for each area)
Area figuresArea, km², measured from the boundary geometry
Boundary sourcechinaadminboundaries dataset
ProjectionAlbers equal-area conic, standard parallels 25°N and 47°N, central meridian 105°E
CoordinatesWGS84 longitude / latitude
LicenseCommercial use permitted; resale of the files is not
RefundsFull refund within 14 days for any reason, and at any time if the file is defective or not as described
Areas included

All 14 prefecture-level cities are in the file:

Baise City, Beihai City, Chongzuo City, Fangchenggang City, Guigang City, Guilin City, Hechi City, Hezhou City, Laibin City, Liuzhou City, Nanning City, Qinzhou City, Wuzhou City, Yulin City.

Choosing

Picture, map chart, or this file?

A map image PowerPoint's map chartThis file
Color one area and leave the rest No — the picture is a single object Yes, shaded from its data Yes — 14 separate shapes
Edit without an internet connectionYes No — place names are resolved through BingYes
Needs a Microsoft 365 or Office 2019 subscriptionNo YesNo — any PowerPoint that opens a .pptx
Rename, delete or move a single areaNoNo Yes — every shape is named in the Selection Pane
CostFreeIncluded with the subscription $19.99, once
Questions

About this template

How do I edit the map?
Right-click it and choose Ungroup, in PowerPoint or Keynote. Each region then becomes a separate editable shape you can recolor, relabel or delete on its own.
Which level am I buying?
This file covers 14 prefecture-level cities. The province-level map, the cities of a province, and the districts of a city are separate products.
Why is there no city tier for the municipalities?
Beijing, Tianjin, Shanghai and Chongqing are province-level municipalities: their districts report straight to the city, with no prefecture-level tier in between. Taiwan, Hong Kong and Macao follow the same two-level pattern.
How do I match my own figures to the map?
Every shape carries its GB administrative code, and the codes nest — a county's begins with its city's. Join on the code rather than the name: names are neither unique nor stable across the country.
Does it work in Google Slides and Keynote?
Yes. The files contain only shapes, solid fills and Arial, so nothing is dropped or converted on import.
Keep exploring

Related maps

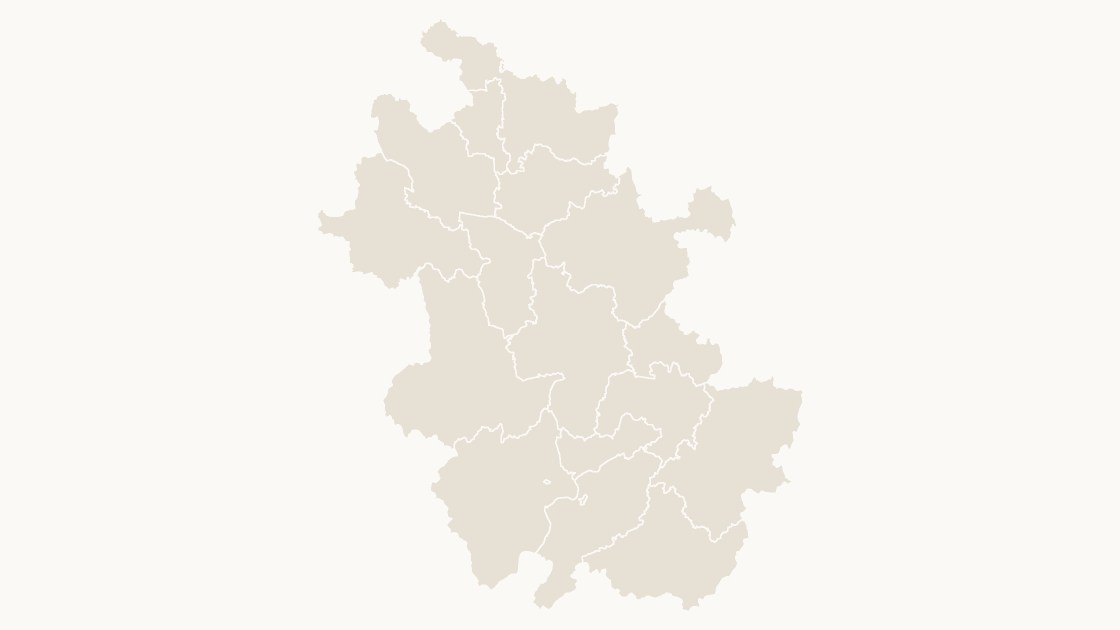
Anhui Cities map preview $19.99
Provinces

Anhui Cities

The 16 prefecture-level cities of Anhui as separate shapes, sized for a slide rather than a wall.

16 prefecture-level cities 3 themes
Fujian Cities map preview $19.99
Provinces

Fujian Cities

The 9 prefecture-level cities of Fujian as separate shapes, sized for a slide rather than a wall.
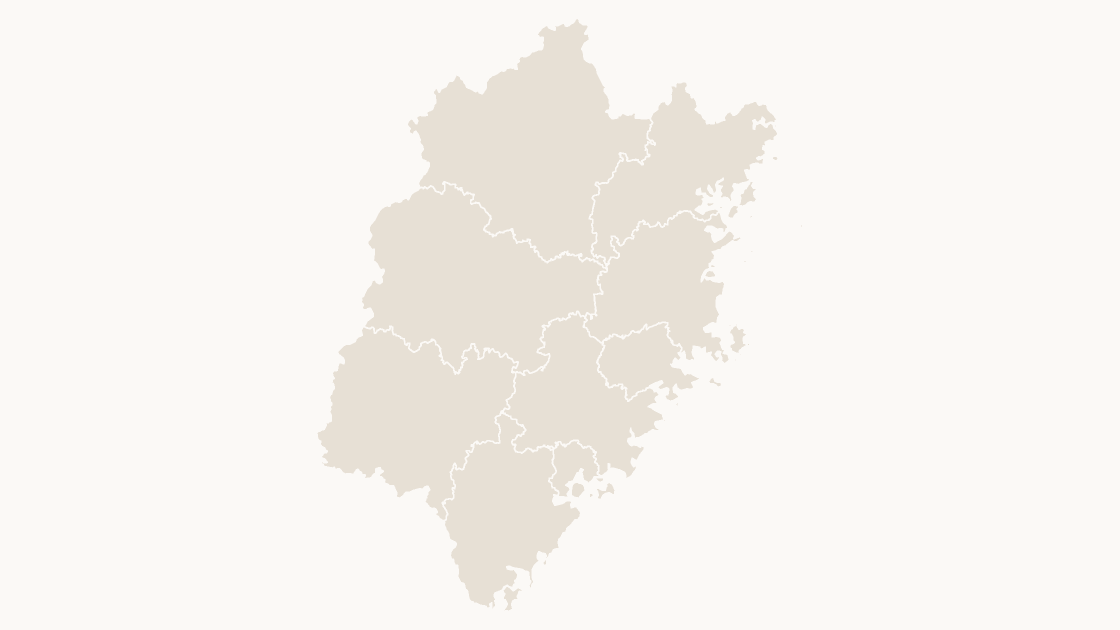
9 prefecture-level cities 3 themes
Gansu Cities map preview $19.99
Provinces

Gansu Cities

The 17 prefecture-level cities of Gansu as separate shapes, sized for a slide rather than a wall.
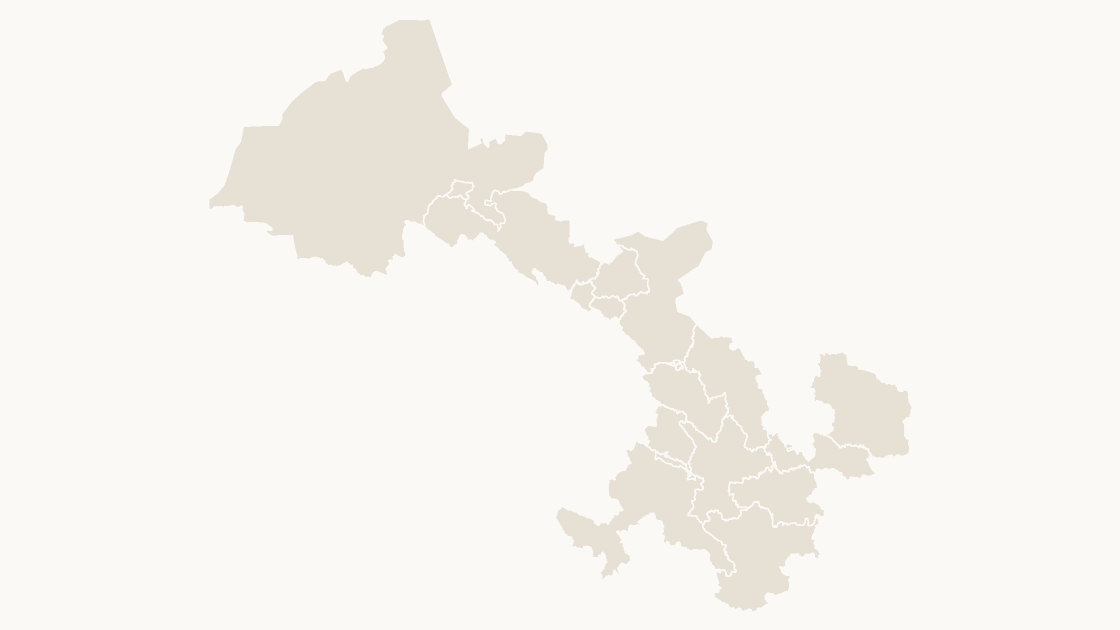
17 prefecture-level cities 3 themes